

Question: a workbooks? Your recent changes were saved. Do you want to continue working where you left F4 4 X V fx A B C D
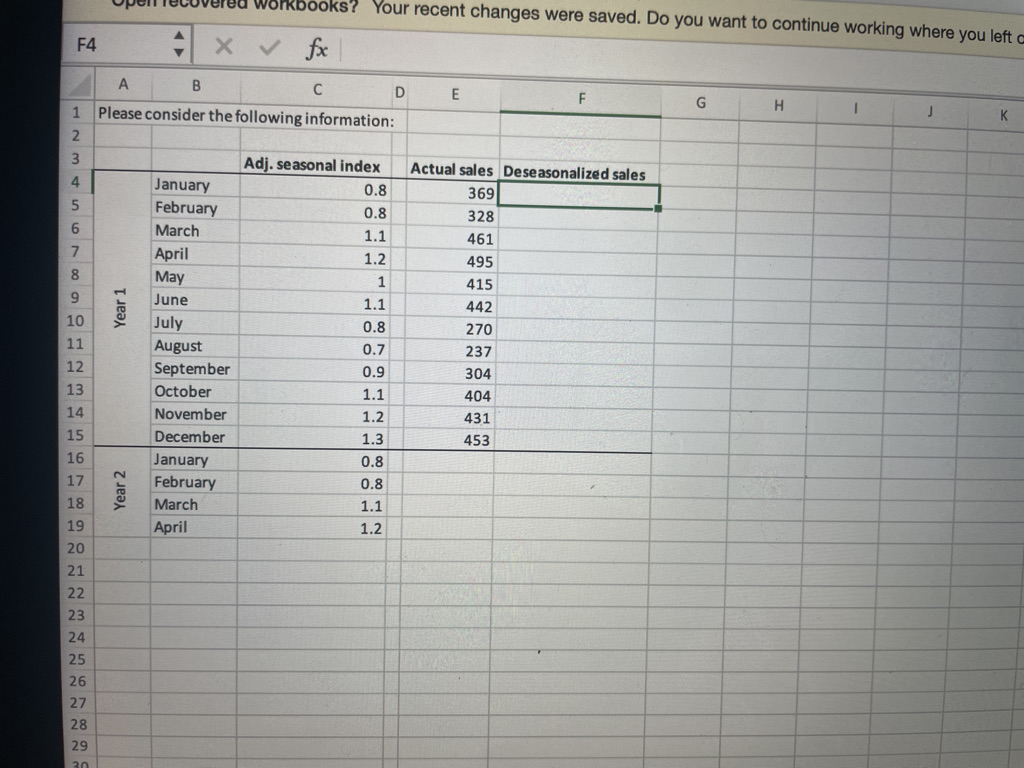
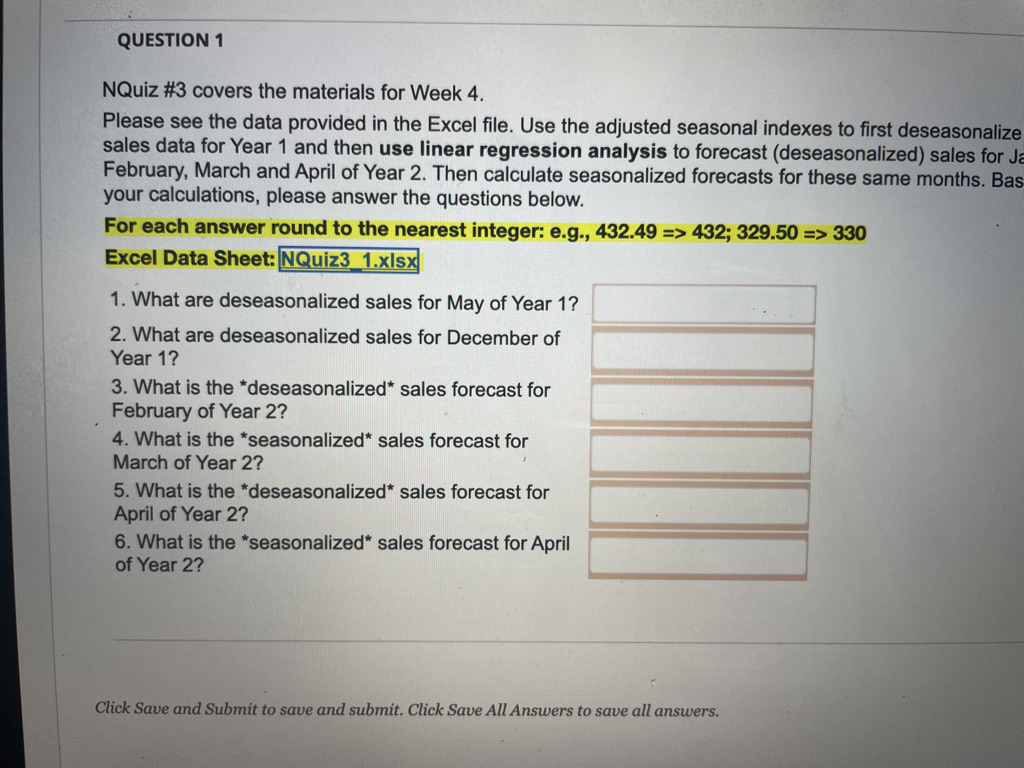
a workbooks? Your recent changes were saved. Do you want to continue working where you left F4 4 X V fx A B C D E F G H K Please consider the following information: Adj. seasonal index Actual sales Deseasonalized sales January 0.8 369 February 0.8 328 March 1.1 461 April 1.2 495 May 1 415 9 June 1.1 442 Year 1 10 July 0.8 270 11 August 0.7 237 12 September 0.9 304 13 October 1.1 404 14 November 1.2 431 15 December 1.3 453 16 January 0.8 17 February 0.8 Year 2 18 March 1.1 19 April 1.2 20 21 22 23 24 25 26 27 28 29QUESTION 1 NQuiz #3 covers the materials for Week 4. Please see the data provided in the Excel file. Use the adjusted seasonal indexes to first deseasonalize sales data for Year 1 and then use linear regression analysis to forecast (deseasonalized) sales for Ja February, March and April of Year 2. Then calculate seasonalized forecasts for these same months. Bas your calculations, please answer the questions below. For each answer round to the nearest integer: e.g., 432.49 => 432; 329.50 => 330 Excel Data Sheet: NQuiz3 1.xIsx 1. What are deseasonalized sales for May of Year 1? 2. What are deseasonalized sales for December of Year 1? 3. What is the *deseasonalized* sales forecast for February of Year 2? 4. What is the *seasonalized* sales forecast for March of Year 2? 5. What is the *deseasonalized* sales forecast for April of Year 2? 6. What is the *seasonalized* sales forecast for April of Year 2? Click Save and Submit to save and submit. Click Save All Answers to save all answers
Step by Step Solution
There are 3 Steps involved in it

Get step-by-step solutions from verified subject matter experts