

Question: a) Write a brief report interpreting what the displays show. Choose the correct answer below. A. The charts show that hull failure and collision are
a) Write a brief report interpreting what the displays show. Choose the correct answer below.
A. The charts show that hull failure and collision are the most frequent causes of oil spills. Many also have unknown causes.
B. The charts show that grounding, fire and explosion are the most frequent causes of oil spills. Many also have unknown causes.
C. The charts show that hull failure, fire, and explosion are the most frequent causes of oil spills. Very few have unknown causes.
D. The charts show that grounding and collision are the most frequent causes of oil spills. Very few have unknown causes.
b) Is a pie chart an appropriate display for these data? Why or why not?
A. A pie chart does not seem appropriate for these data because the proportions shown by each slice of the pie add up to 100%, and each oil spill falls into only one category.
B. A pie chart seems appropriate for these data because the proportions shown by each slice of the pie add up to 100%, and some oils spills fall into more than one category.
C. A pie chart seems appropriate for these data because the proportions shown by each slice of the pie add up to 100%, and each oil spill falls into only one category.
D. A pie chart does not seem appropriate for these data because the proportions shown by each slice of the pie add up to 100%, and some oils spills fall into more than one category
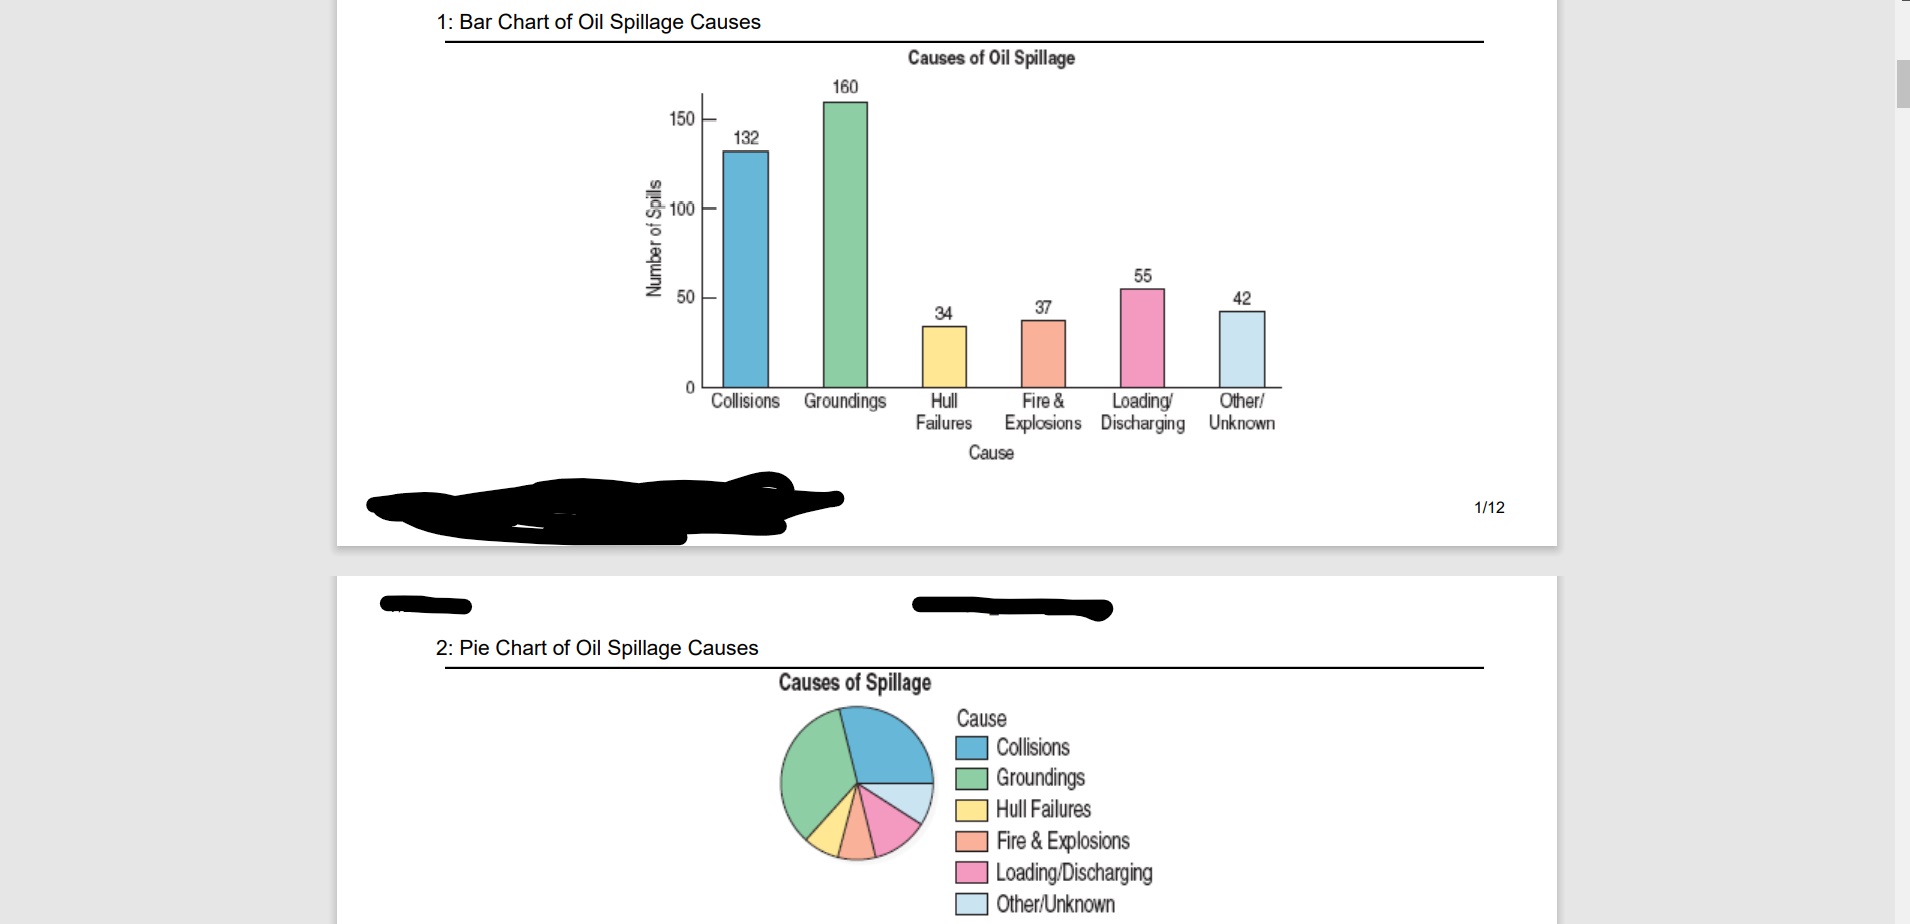
1: Bar Chart of Oil Spillage Causes Causes of Oil Spillage 160 150 132 - 100 - Number of Spills 55 50 42 34 37 Collisions Groundings Hull Fire & Loading Other/ Failures Explosions Discharging Unknown Cause 1/12 2: Pie Chart of Oil Spillage Causes Causes of Spillage Cause Collisions Groundings Hull Failures Fire & Explosions Loading/Discharging Other/Unknown
Step by Step Solution
There are 3 Steps involved in it

Get step-by-step solutions from verified subject matter experts