

Question: ( a ) Write a program to plot a bar chart in python to display the pass percentage of Department of Operational Research for five
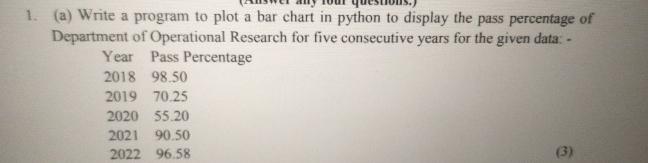
a Write a program to plot a bar chart in python to display the pass percentage of Department of Operational Research for five consecutive years for the given data:
tableYearPass Percentage
Step by Step Solution
There are 3 Steps involved in it
1 Expert Approved Answer
Step: 1 Unlock

Question Has Been Solved by an Expert!
Get step-by-step solutions from verified subject matter experts
Step: 2 Unlock
Step: 3 Unlock