

Question: a . Write a Python program ( Q 1 _ code A . py ) to write the above data on to an Excel file,
a Write a Python program Qcode
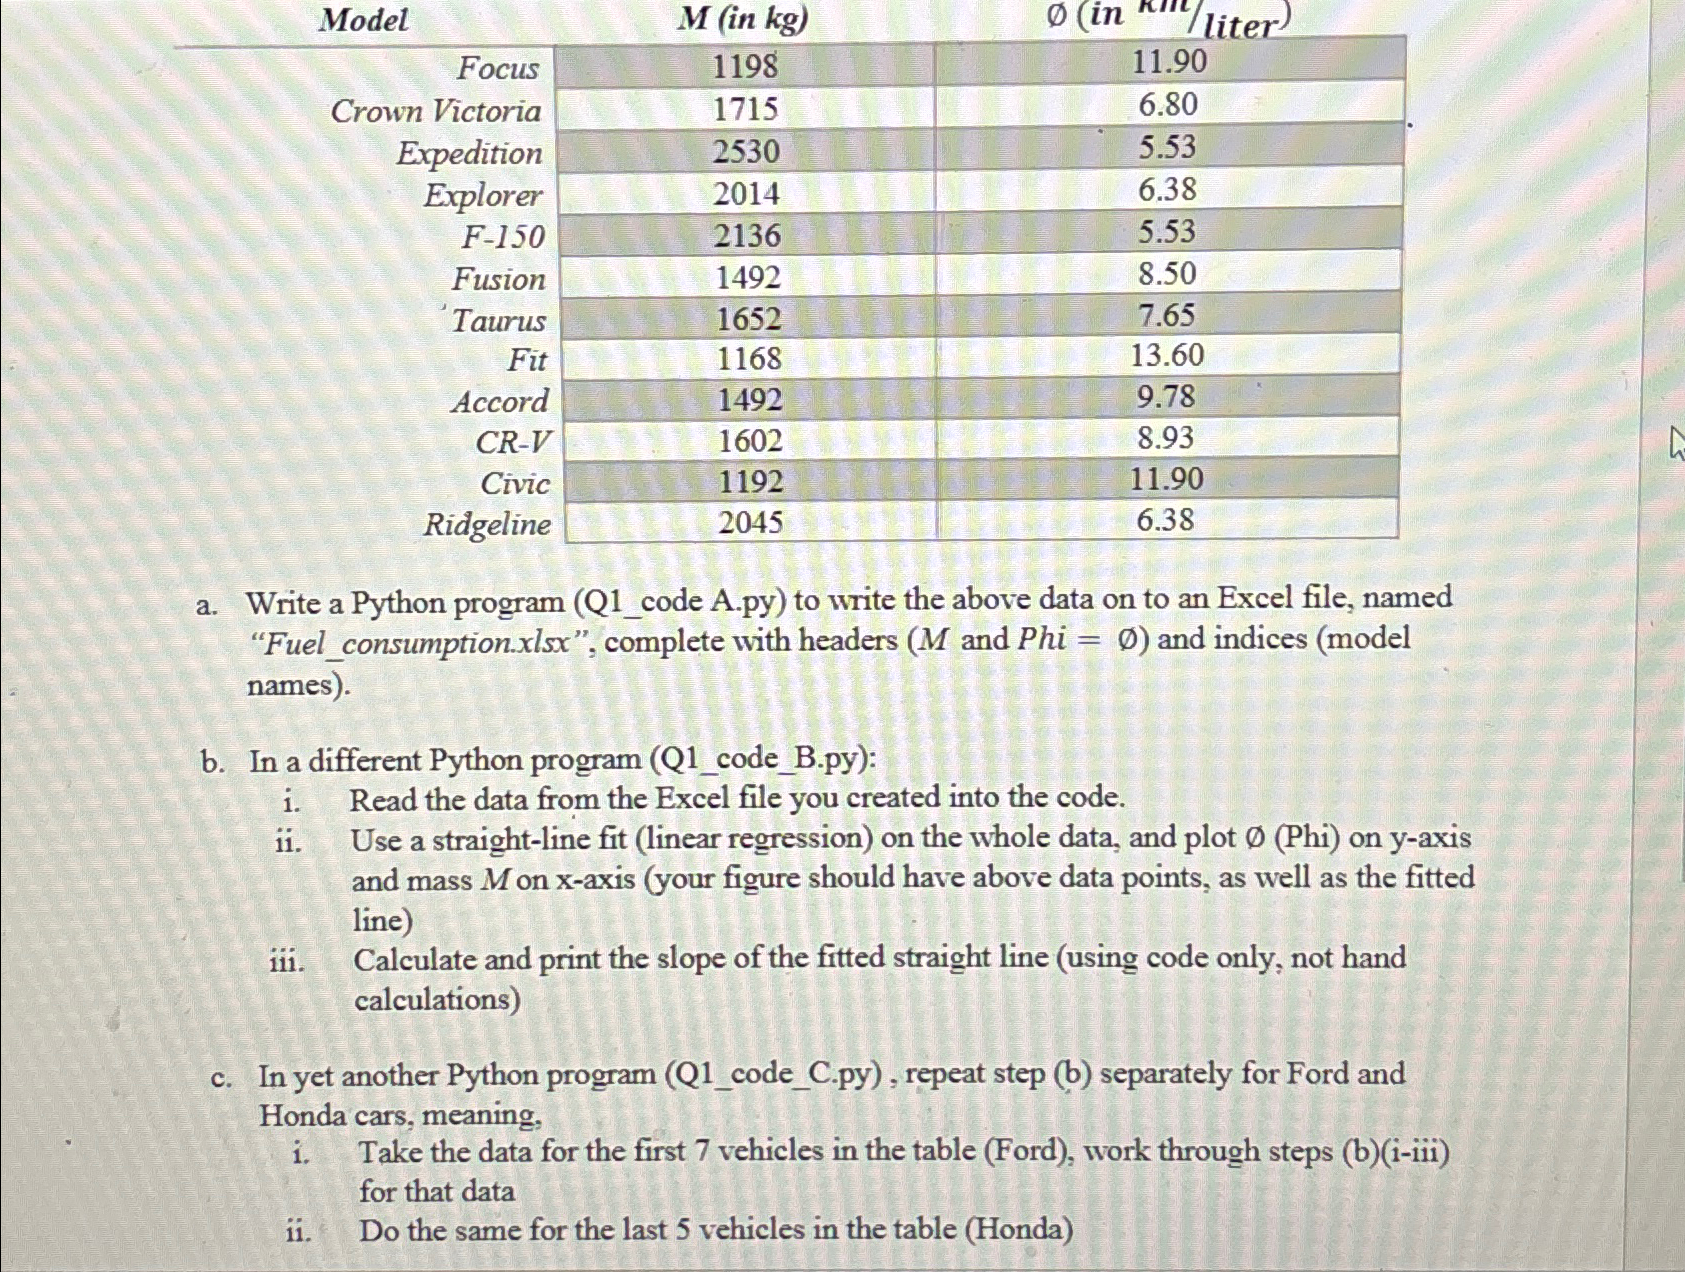
Apy to write the above data on to an Excel file, named "Fuelconsumption.xlsx complete with headers and and indices model names
b In a different Python program QcodeBpy:
i Read the data from the Excel file you created into the code.
ii Use a straightline fit linear regression on the whole data, and plot Phi on yaxis and mass on axis your figure should have above data points, as well as the fitted line
iii. Calculate and print the slope of the fitted straight line using code only, not hand calculations
c In yet another Python program QcodeCpy repeat step b separately for Ford and Honda cars, meaning,
i Take the data for the first vehicles in the table Ford work through steps biiii for that data
ii Do the same for the last vehicles in the table Honda
Step by Step Solution
There are 3 Steps involved in it
1 Expert Approved Answer
Step: 1 Unlock

Question Has Been Solved by an Expert!
Get step-by-step solutions from verified subject matter experts
Step: 2 Unlock
Step: 3 Unlock