

Question: a. Write out the linear model. b. Interpret the intercept. c. Interpret the slope. d. For this model R2 is 46%. Interpret this value. e.
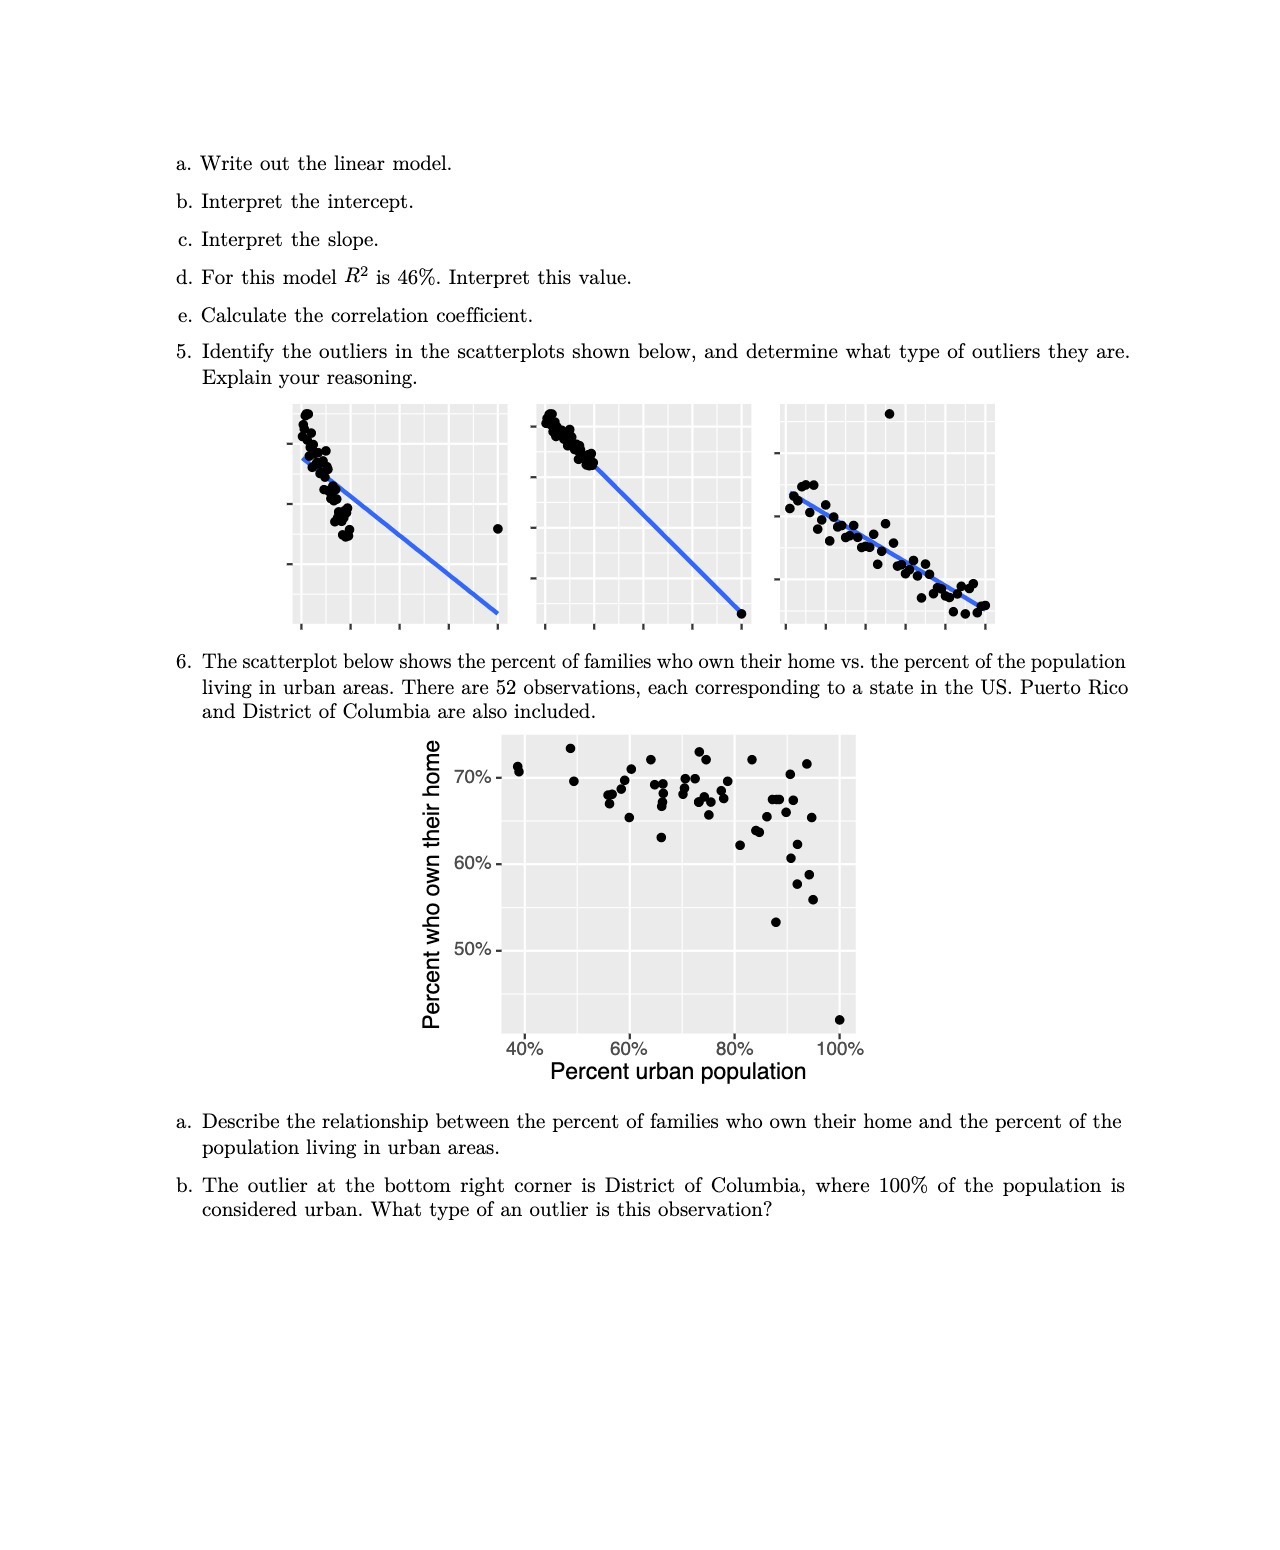
a. Write out the linear model. b. Interpret the intercept. c. Interpret the slope. d. For this model R2 is 46%. Interpret this value. e. Calculate the correlation coefcient. 5. Identify the outliers in the scatterplots shown below, and determine what type of outliers they are. Explain your reasoning. 6. The scatterplot below shows the percent of families who own their home vs. the percent of the population living in urban areas. There are 52 observations, each corresponding to a state in the US. Puerto Rico and District of Columbia are also included. \"5' . s . O o 70%- ' . . o '5 fl 1 r' no '5 O O o 0 o E- . o . o - 0 g 60% .. o . .E O 4.. 50%- C O.) 9 d.) CL 0 46% 66% 36% 10b% Percent urban population a. Describe the relationship between the percent of families who own their home and the percent of the population living in urban areas. b. The outlier at the bottom right corner is District of Columbia, where 100% of the population is considered urban. What type of an outlier is this observation
Step by Step Solution
There are 3 Steps involved in it

Get step-by-step solutions from verified subject matter experts