

Question: a-1. Develop a correlation matrix. {Round your answers to 3 decimal places. Negative amounts should be indicated by a minus sign} Income Size a-2. Do
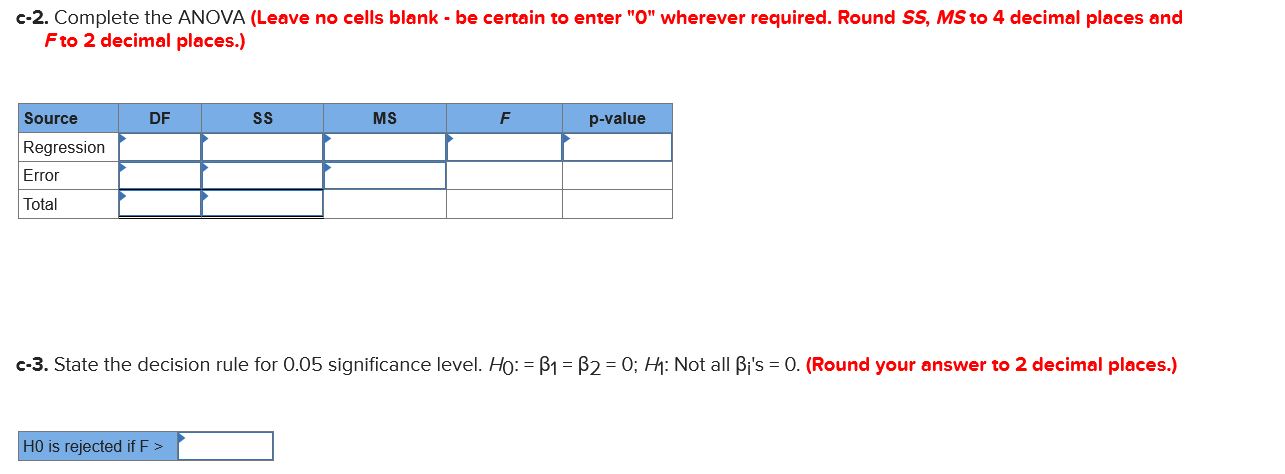

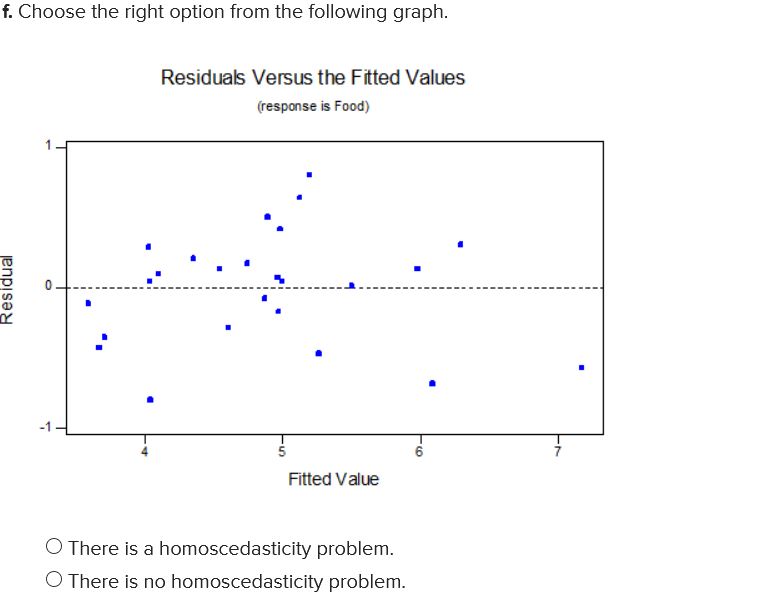
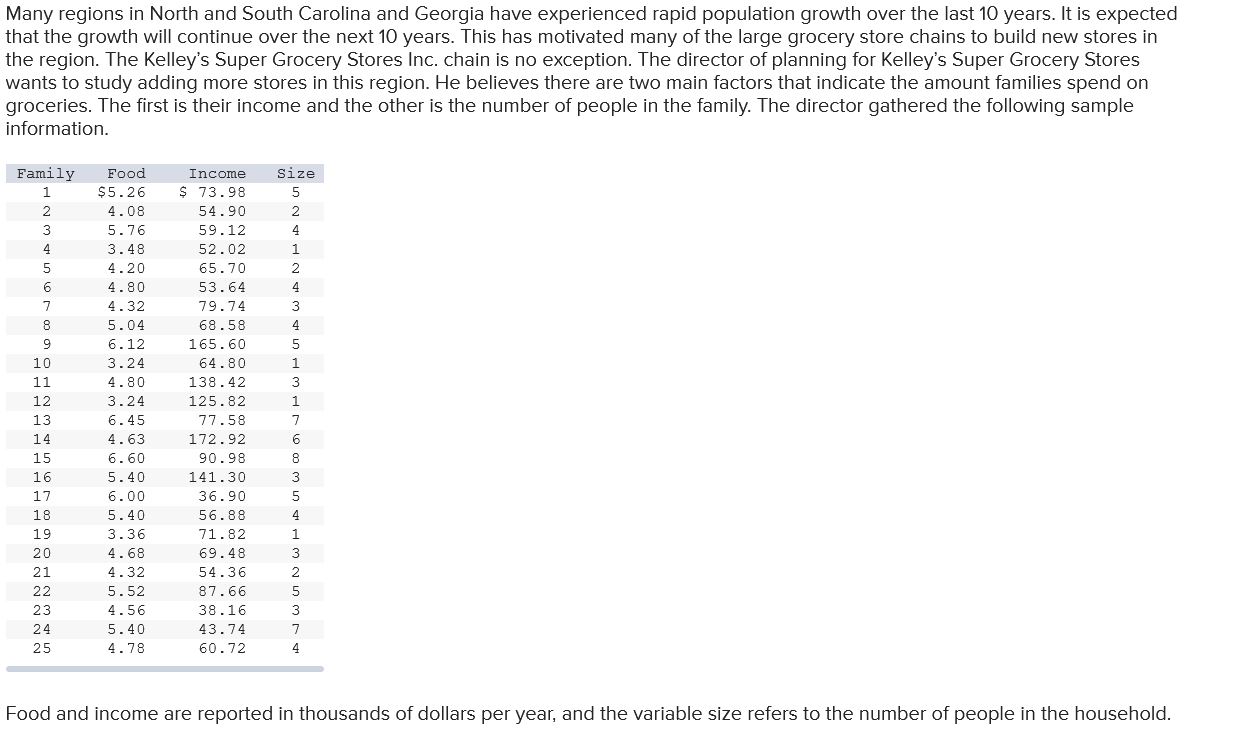
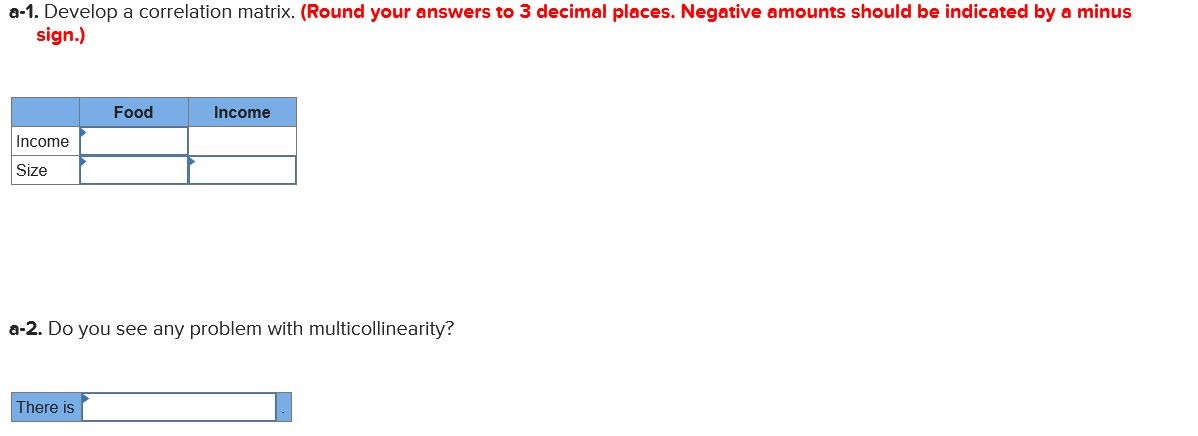
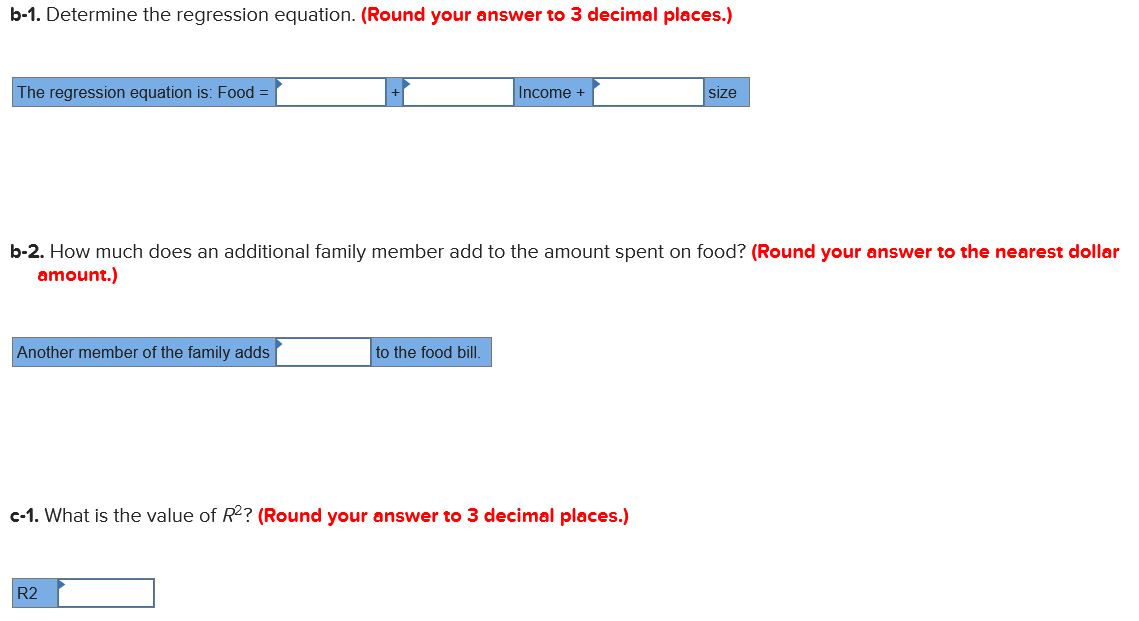

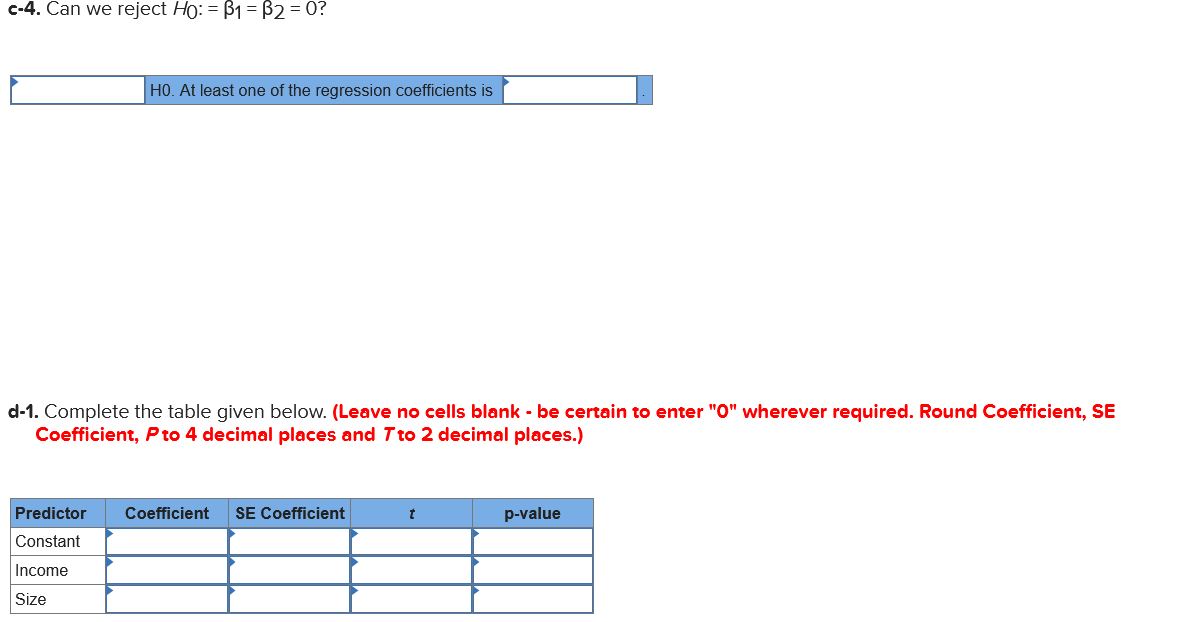


a-1. Develop a correlation matrix. {Round your answers to 3 decimal places. Negative amounts should be indicated by a minus sign} Income Size a-2. Do you see any problem with multicollinearity? -:I b-1. Determine the regression equation. [Round your answer to 3 decimal places.) _:I:-:- b-2. How much does an additional family member add to the amount spent on food? (Round your answer to the nearest dollar amount.) c-1. What is the value of R2? {Round your answer to 3 decimal places.) -:| c-2. Complete the ANOVA (Leave no cells blank - be certain to enter "0" wherever required. Round SS, MS to 4 decimal places and Fto 2 decimal places.) Source DF SS MS F p-value Regression Error Total c-3. State the decision rule for 0.05 significance level. Ho: = $1 = $2 = 0; /1: Not all Bi's = 0. (Round your answer to 2 decimal places.) HO is rejected if F >c-4. Can we reject Ho: = $1 = $2 = 0? HO. At least one of the regression coefficients is d-1. Complete the table given below. (Leave no cells blank - be certain to enter "0" wherever required. Round Coefficient, SE Coefficient, Pto 4 decimal places and 7 to 2 decimal places.) Predictor Coefficient SE Coefficient t p-value Constant Income Sizef. Choose the right option from the following graph. Residuals Versus the Fined Values mammehmm Residual D 4 5 6 Filled Value 0 There is a homoscedasticity problem. 0 There is no homoscedasticity problem. Many regions in North and South Carolina and Georgia have experienced rapid population growth over the last 10 years. It is expected that the growth will continue overthe next 10 years. This has motivated many ofthe large grocery store chains to build new stores in the region. The Kelley's Super Grocery Stores Inc. chain is no exception. The director of planning for Kelley's Super Grocery Stores wants to study adding more stores in this region. He believes there are two main factors that indicate the amount families spend on groceries. The rst is their income and the other is the number of people in the family. The director gathered the following sample information. Family Food 1 $5.26 2 4.08 3 5.76 4 3.48 5 4.20 6 4.80 7 4.32 8 5.04 9 6.12 10 3.24 11 4.80 12 3.24 13 6.45 14 4.63 15 6.60 16 5.40 17 6.00 18 5.40 19 3.36 20 4.68 21 4.32 22 5.52 23 4.56 24 5.40 25 4.78 IIICOIIIB 5 73. .90 59. 52. 65. 53. 79. 68. 165. .80 138. 125. 77. 172. 90. 141. 36. 56. 71. 69. .36 87. 38. 43. 60. 54 64 54 98 12 02 70 64 74 58 60 42 82 58 92 98 30 90 88 82 48 66 16 74 72 Size Jh-quU'ini-'Jhmwoamqu-'LJl-'U'lJt-wJE-Nl-'JhNU'I Food and income are reported in thousands of dollars per year, and the variable size refers to the number of people in the household
Step by Step Solution
There are 3 Steps involved in it

Get step-by-step solutions from verified subject matter experts