

Question: A1 fx Beach A B C - Beach 2011 2012 2 Bennetts Pier 35282 21814 Big Stone 359350 83500 4 Broadkill 45705 13290 5 Cape
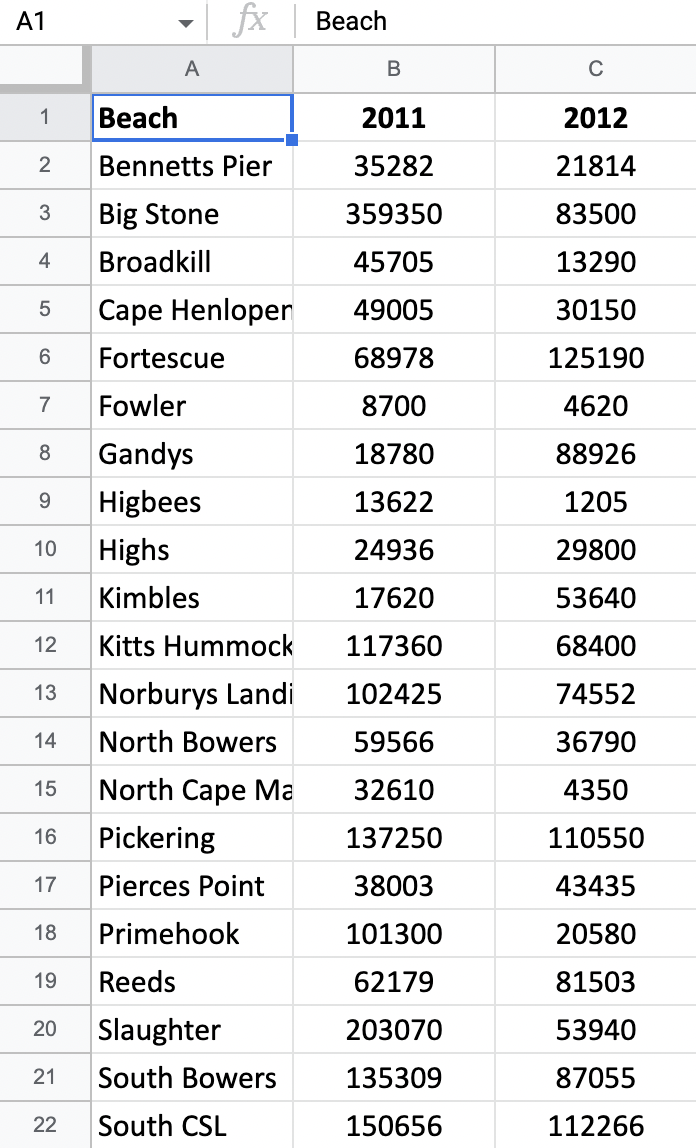
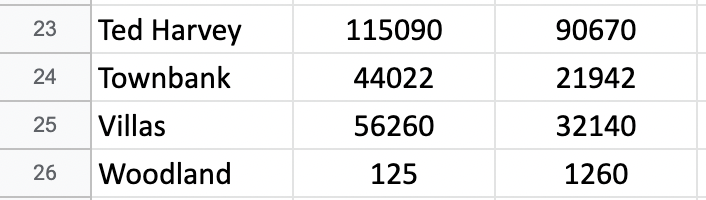
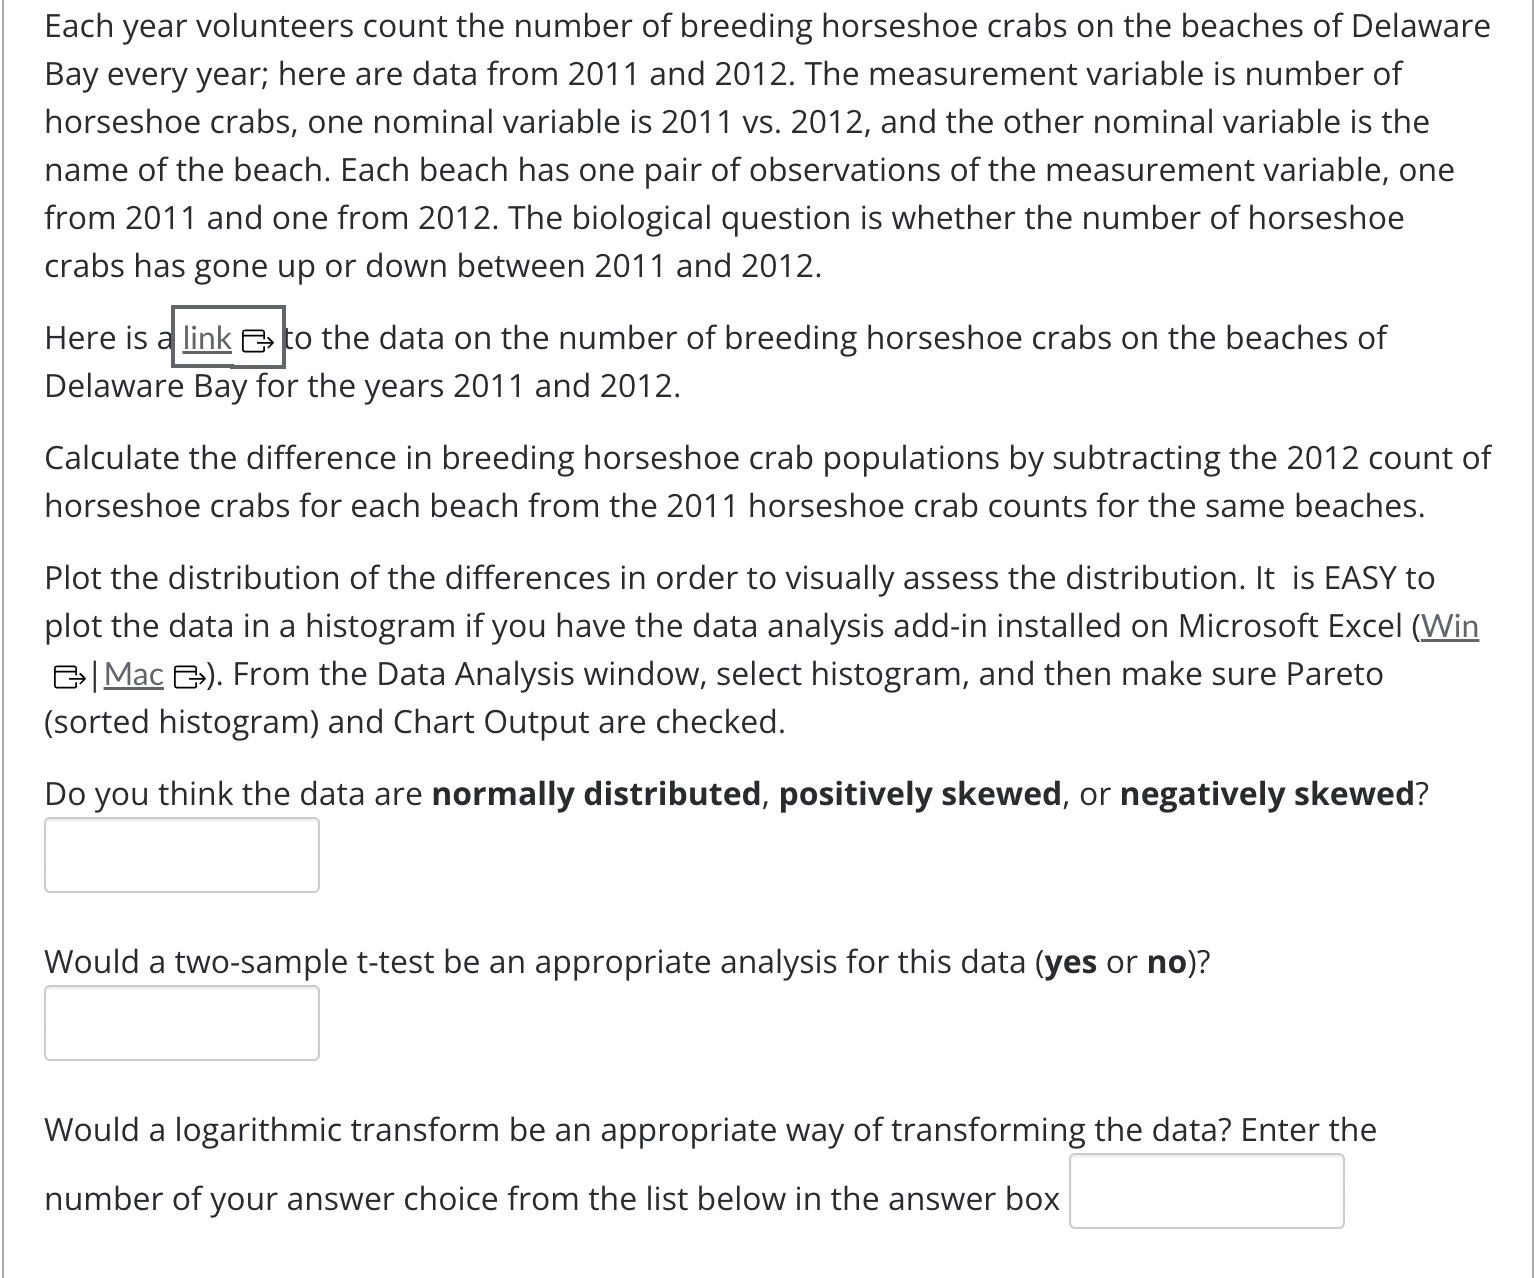
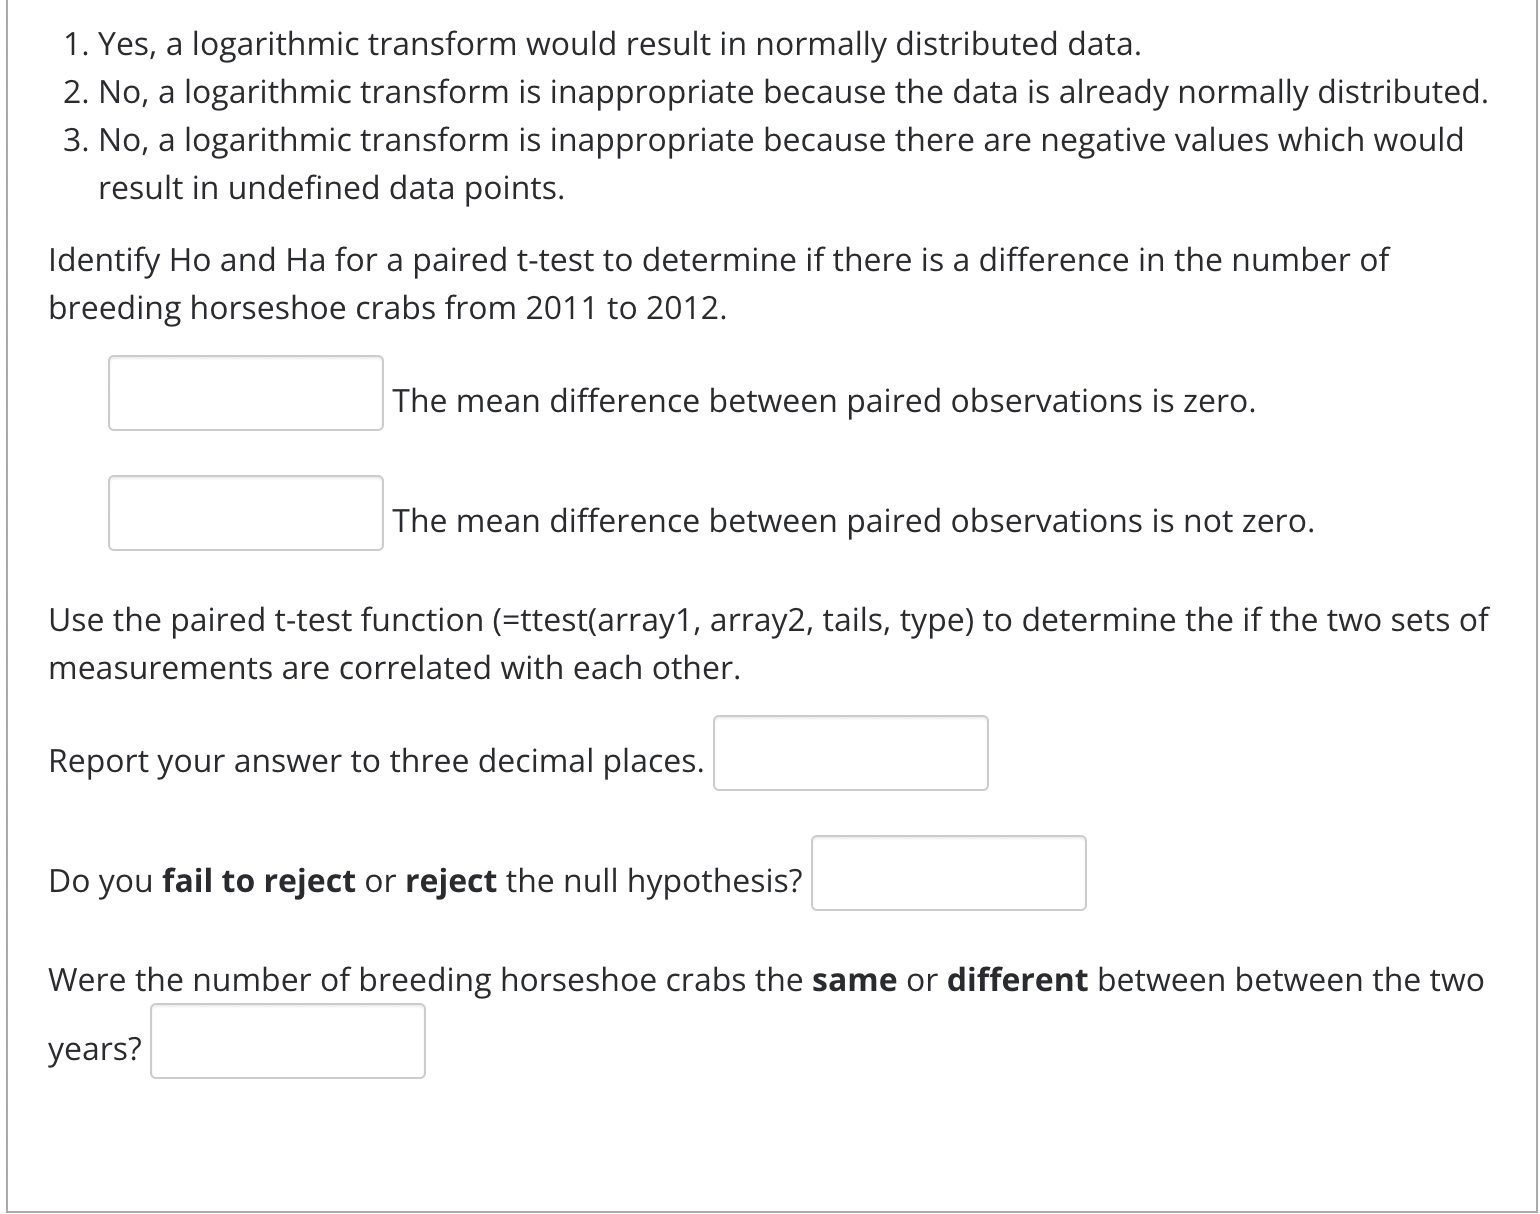
A1 fx Beach A B C - Beach 2011 2012 2 Bennetts Pier 35282 21814 Big Stone 359350 83500 4 Broadkill 45705 13290 5 Cape Henlopen 49005 30150 6 Fortescue 68978 125190 7 Fowler 8700 4620 8 Gandys 18780 88926 9 Higbees 13622 1205 10 Highs 24936 29800 11 Kimbles 17620 53640 12 Kitts Hummock 117360 68400 13 Norburys Landi 102425 74552 14 North Bowers 59566 36790 15 North Cape Ma 32610 4350 16 Pickering 137250 110550 17 Pierces Point 38003 43435 18 Primehook 101300 20580 19 Reeds 62179 81503 20 Slaughter 203070 53940 21 South Bowers 135309 87055 22 South CSL 150656 11226623 Ted Harvey 115090 90670 24 Townbank 44022 21942 25 Villas 56260 32140 26 Woodland 125 1260Each year volunteers count the number of breeding horseshoe crabs on the beaches of Delaware Bay every year; here are data from 2011 and 2012. The measurement variable is number of horseshoe crabs, one nominal variable is 2011 vs. 2012, and the other nominal variable is the name ofthe beach. Each beach has one pair of observations ofthe measurement variable, one from 2011 and one from 2012. The biological question is whether the number of horseshoe crabs has gone up or down between 2011 and 2012. Here is - o the data on the number of breeding horseshoe crabs on the beaches of Delaware Bay for the years 2011 and 2012. Calculate the difference in breeding horseshoe crab populations by subtracting the 2012 count of horseshoe crabs for each beach from the 2011 horseshoe crab counts for the same beaches. Plot the distribution of the differences in order to visually assess the distribution. It is EASY to plot the data in a histogram if you have the data analysis add-in installed on Microsoft Excel (Win E>| Mac 13). From the Data Analysis window, select histogram, and then make sure Pareto (sorted histogram) and Chart Output are checked. Do you think the data are normally distributed, positively skewed, or negatively skewed? Would a two-sample t-test be an appropriate analysis for this data (yes or no)? Would a logarithmic transform be an appropriate way of transforming the data? Enter the number of your answer choice from the list below in the answer box 'I. Yes, a logarithmic transform would result in normally distributed data. 2. Nor a logarithmic transform is inappropriate because the data is already normally distributed. 3. Nor a logarithmic transform is inappropriate because there are negative values which would result in undefined data points. Identify Ho and Ha for a paired t-test to determine ifthere is a difference in the number of breeding horseshoe crabs from 2011 to 2012. The mean difference between paired observations is zero. The mean difference between paired observations is not zero. Use the paired t-test function (=ttest(array1, array2, tails, type) to determine the ifthe two sets of measurements are correlated with each other. Report your answer to three decimal places. Do you fail to reject or reject the null hypothesis? Were the number of breeding horseshoe crabs the same or different between between the two yea rs
Step by Step Solution
There are 3 Steps involved in it

Get step-by-step solutions from verified subject matter experts