

Question: A1-2. The table below shows socioeconomic data for a selection of countries for the year 2009 , using the following features: - COUNTRY: The name
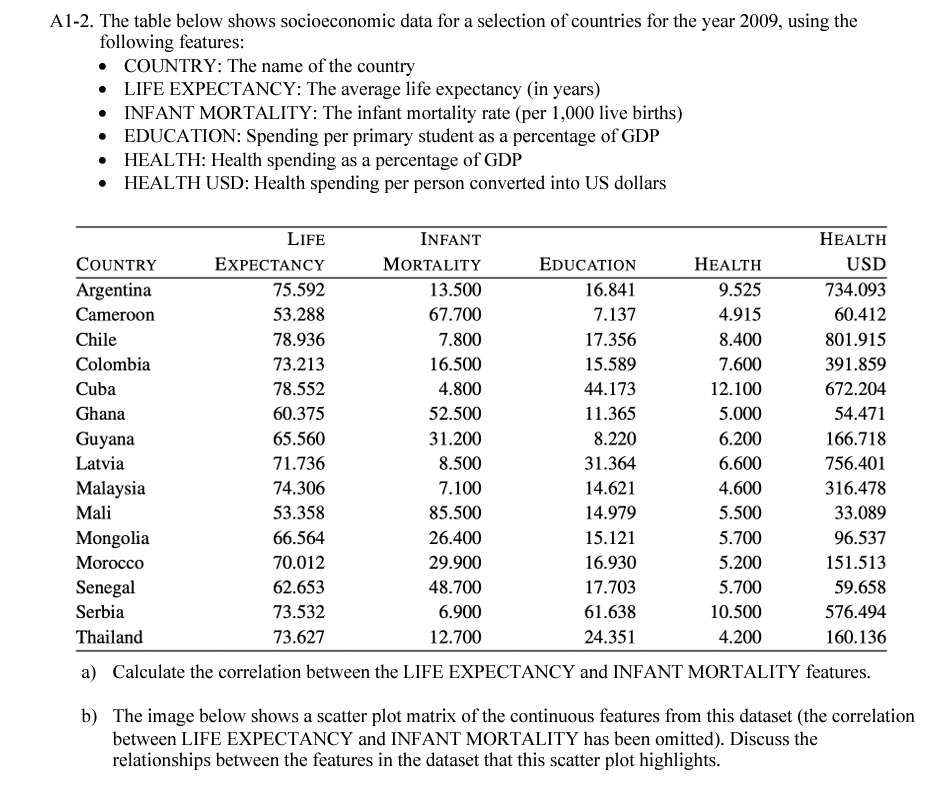
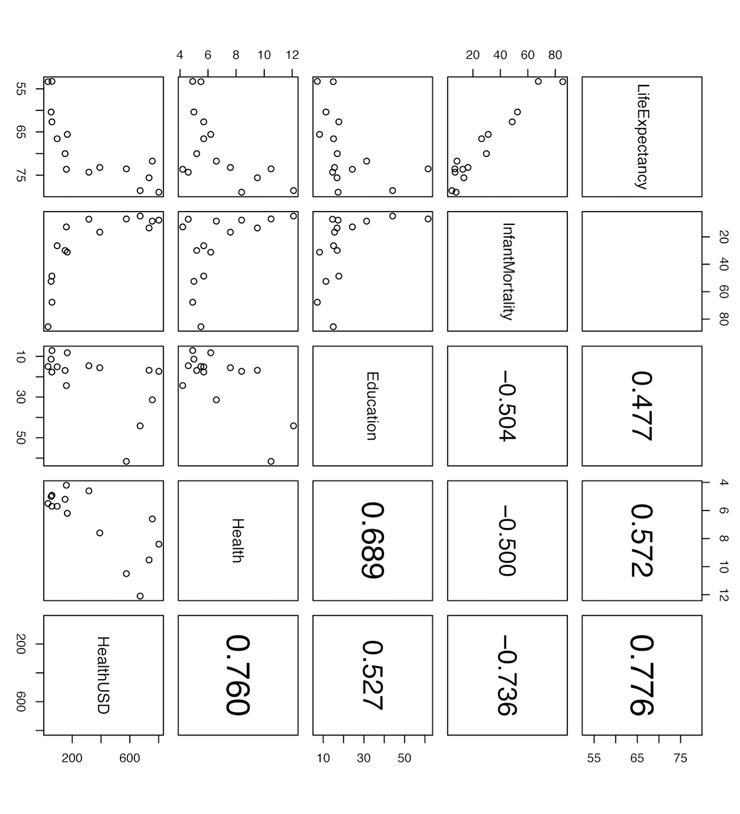
A1-2. The table below shows socioeconomic data for a selection of countries for the year 2009 , using the following features: - COUNTRY: The name of the country - LIFE EXPECTANCY: The average life expectancy (in years) - INFANT MORTALITY: The infant mortality rate (per 1,000 live births) - EDUCATION: Spending per primary student as a percentage of GDP - HEALTH: Health spending as a percentage of GDP - HEALTH USD: Health spending per person converted into US dollars a) Calculate the correlation between the LIFE EXPECTANCY and INFANT MORTALITY features. b) The image below shows a scatter plot matrix of the continuous features from this dataset (the correlation between LIFE EXPECTANCY and INFANT MORTALITY has been omitted). Discuss the relationships between the features in the dataset that this scatter plot highlights
Step by Step Solution
There are 3 Steps involved in it

Get step-by-step solutions from verified subject matter experts