

Question: A19 A B C D E F G . 1 J K L M 1 Attached is Services Revenue from an analytics company 2 3
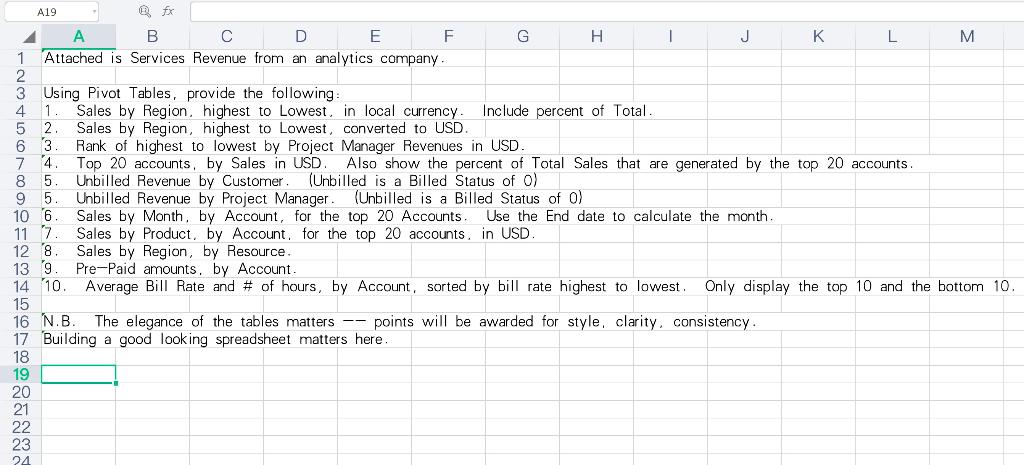
A19 A B C D E F G . 1 J K L M 1 Attached is Services Revenue from an analytics company 2 3 Using Pivot Tables, provide the following 4 1 Sales by Region, highest to Lowest. in local currency Include percent of Total 5 2 Sales by Region, highest to Lowest, converted to USD. 63 Rank of highest to lowest by Project Manager Revenues in USD. 7 4. Top 20 accounts, by Sales in USD. Also show the percent of Total Sales that are generated by the top 20 accounts. 8 5 Unbilled Revenue by Customer (Unbilled is a Billed Status of o) 9 5. Unbilled Revenue by Project Manager (Unbilled is a Billed Status of o) 106 Sales by Month, by Account, for the top 20 Accounts. Use the End date to calculate the month. 11 7 Sales by Product, by Account for the top 20 accounts, in USD 12 8 Sales by Region, by Resource. 13 9 Pre-Paid amounts. by Account 14 10. Average Bill Rate and # of hours, by Account, sorted by bill rate highest to lowest. Only display the top 10 and the bottom 10. 15 16 N.B. The elegance of the tables matters -- points will be awarded for style, clarity, consistency. 17 Building a good looking spreadsheet matters here. 18 19 20 21 22 23 A19 A B C D E F G . 1 J K L M 1 Attached is Services Revenue from an analytics company 2 3 Using Pivot Tables, provide the following 4 1 Sales by Region, highest to Lowest. in local currency Include percent of Total 5 2 Sales by Region, highest to Lowest, converted to USD. 63 Rank of highest to lowest by Project Manager Revenues in USD. 7 4. Top 20 accounts, by Sales in USD. Also show the percent of Total Sales that are generated by the top 20 accounts. 8 5 Unbilled Revenue by Customer (Unbilled is a Billed Status of o) 9 5. Unbilled Revenue by Project Manager (Unbilled is a Billed Status of o) 106 Sales by Month, by Account, for the top 20 Accounts. Use the End date to calculate the month. 11 7 Sales by Product, by Account for the top 20 accounts, in USD 12 8 Sales by Region, by Resource. 13 9 Pre-Paid amounts. by Account 14 10. Average Bill Rate and # of hours, by Account, sorted by bill rate highest to lowest. Only display the top 10 and the bottom 10. 15 16 N.B. The elegance of the tables matters -- points will be awarded for style, clarity, consistency. 17 Building a good looking spreadsheet matters here. 18 19 20 21 22 23
Step by Step Solution
There are 3 Steps involved in it

Get step-by-step solutions from verified subject matter experts