

Question: a3plot1.txt is below Write a complete Java program that draws a scatterplot by reading in points of data from a file and displaying them. The
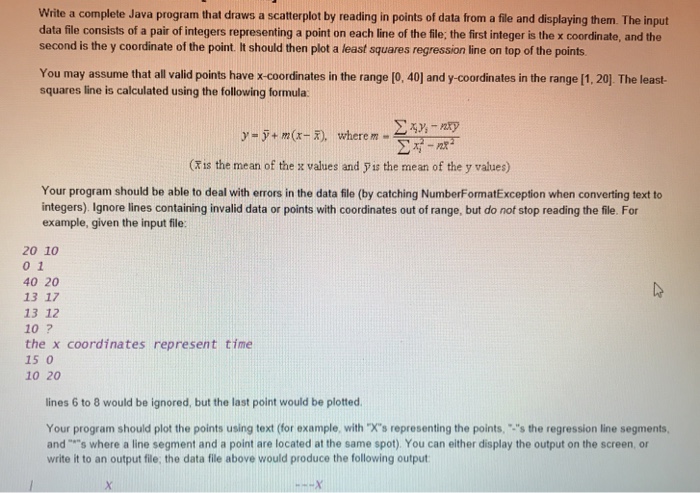
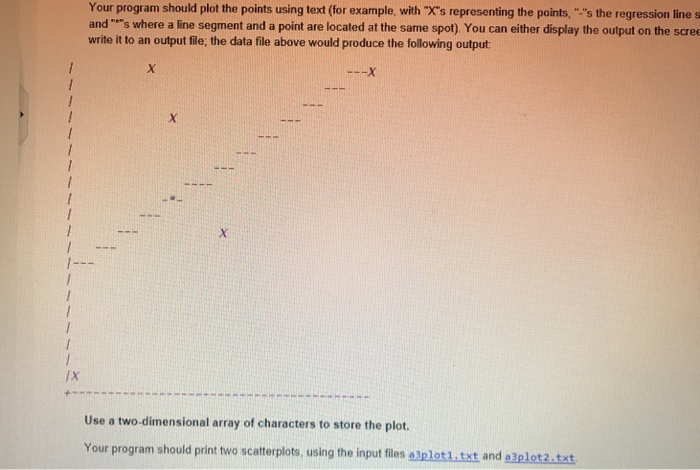
Write a complete Java program that draws a scatterplot by reading in points of data from a file and displaying them. The input data file consists of a pair of integers representing a point on each line of the file; the first integer is the x coordinate, and the second is the y coordinate of the point. It should then pot a least squares regression line on top of the points You may assume that all valid points have -coordinates in the range [0, 40] and y-coordinates in the range [1, 20]. The least- squares line is calculated using the following formula y y +m(x-z), where m- is the mean of the x values and pis the mean of the y values) Your program should be able to deal with errors in the data file (by catching NumberFormatException when converting text to integers), Ignore lines containing invalid data or points with coordinates out of range, but do not stop reading the file. For example, given the input file: 20 10 0 1 40 20 13 17 13 12 10 ? the x coordinates represent time 15 0 10 20 lines 6 to 8 would be ignored, but the last point would be plotted Your program should plot the points using text (for example, with X's representing the points, "-'s the regression line segments and""s where a line segment and a point are located at the same spot). You can either display the output on the screen, or write it to an output file, the data file above would produce the following output
Step by Step Solution
There are 3 Steps involved in it

Get step-by-step solutions from verified subject matter experts