

Question: Cobb and Douglas (1928) defined their production function using data from the USA economy from 1899 to 1922, relating output function Q = Q(K,
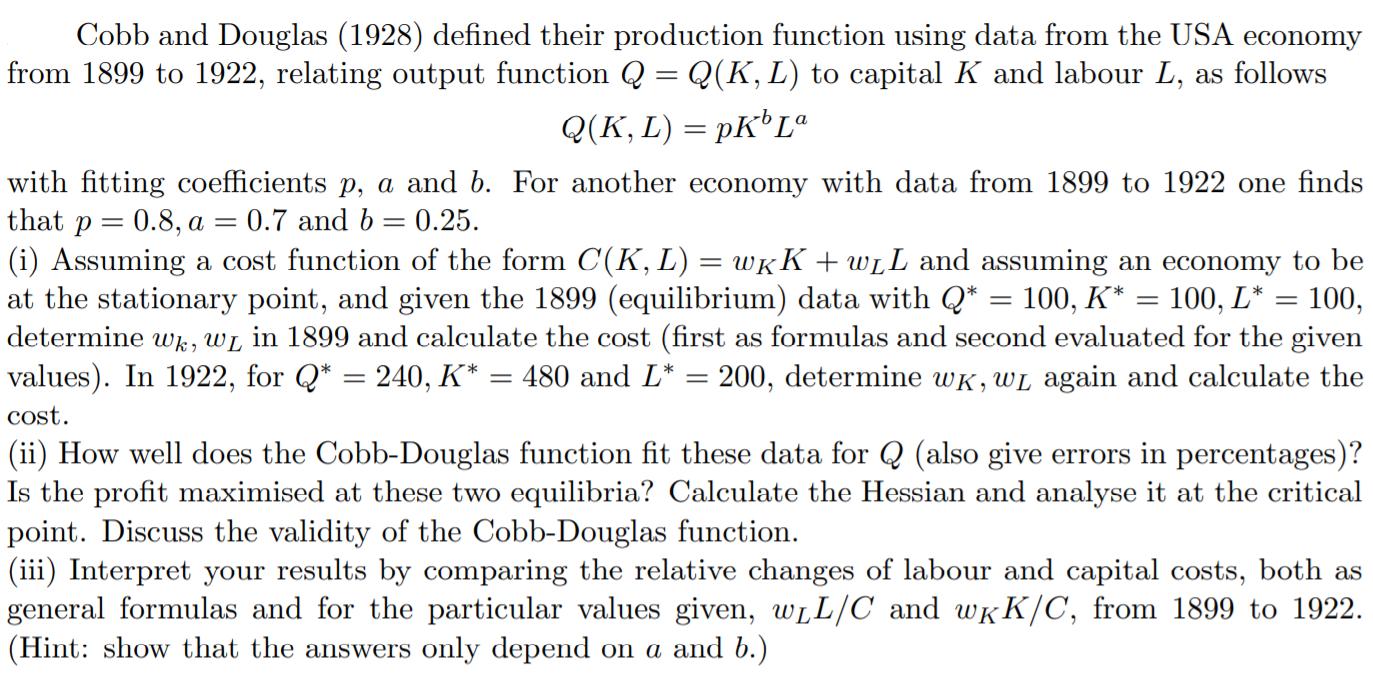
Cobb and Douglas (1928) defined their production function using data from the USA economy from 1899 to 1922, relating output function Q = Q(K, L) to capital K and labour L, as follows Q(K, L) = pKb La with fitting coefficients p, a and b. For another economy with data from 1899 to 1922 one finds that p = 0.8, a = 0.7 and b = 0.25. (i) Assuming a cost function of the form C(K, L) = wK + wL and assuming an economy to be at the stationary point, and given the 1899 (equilibrium) data with Q* = 100, K* 100, L* = 100, determine wk, w in 1899 and calculate the cost (first as formulas and second evaluated for the given values). In 1922, for Q* = 240, K* = 480 and L* = 200, determine wK, WL again and calculate the cost. = (ii) How well does the Cobb-Douglas function fit these data for Q (also give errors in percentages)? Is the profit maximised at these two equilibria? Calculate the Hessian and analyse it at the critical point. Discuss the validity of the Cobb-Douglas function. (iii) Interpret your results by comparing the relative changes of labour and capital costs, both as general formulas and for the particular values given, wLL/C and wKK/C, from 1899 to 1922. (Hint: show that the answers only depend on a and b.)
Step by Step Solution
3.52 Rating (179 Votes )
There are 3 Steps involved in it
i For the 1899 data we have the cost function CK L wKK WLL The stationary point is determined by equ... View full answer

Get step-by-step solutions from verified subject matter experts