

Question: AA 11-2 Comparative Analysis LO A1 Use the following comparative figures for Apple and Google. Key Figures Net income (in millions) Cash dividends declared
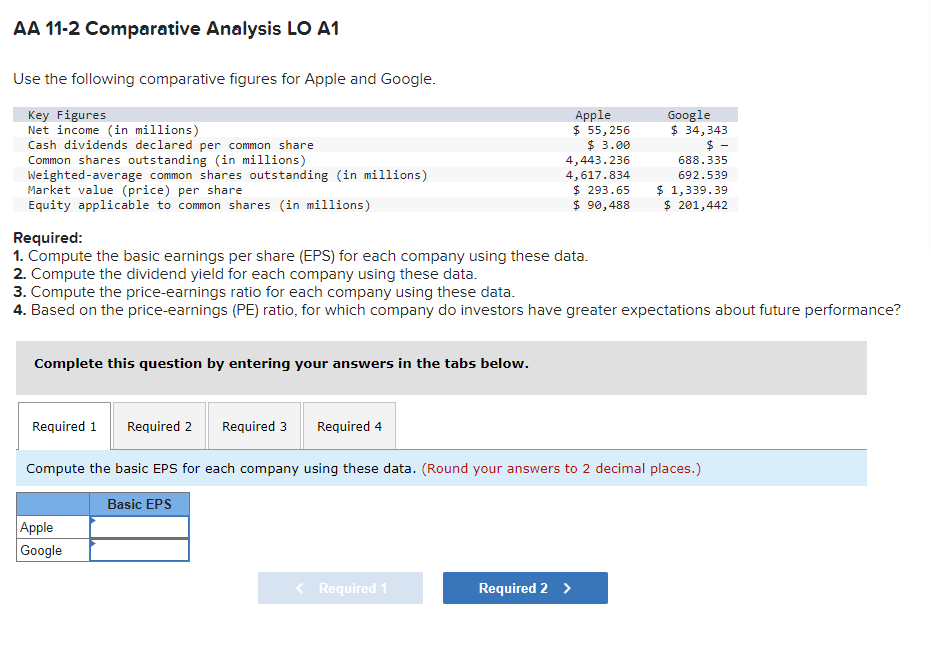
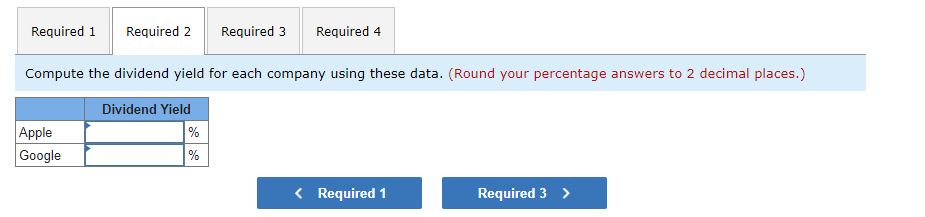
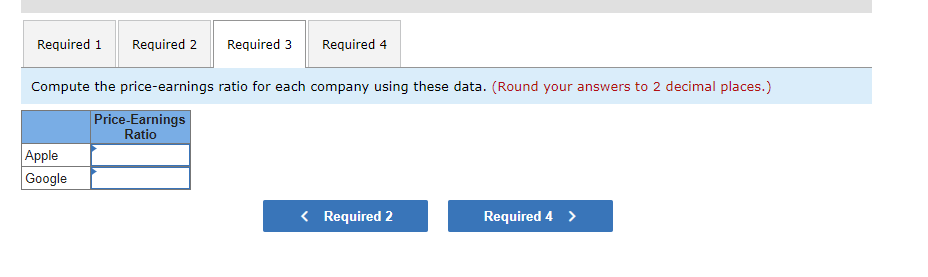
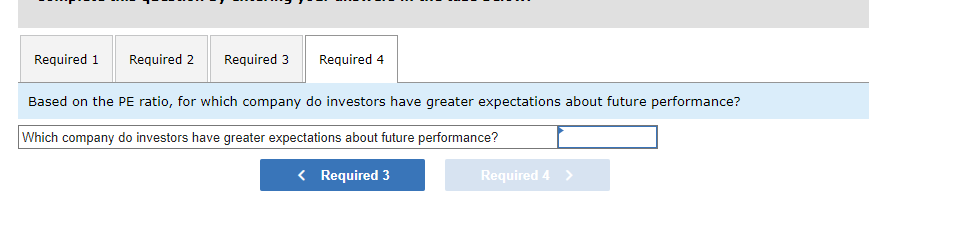
AA 11-2 Comparative Analysis LO A1 Use the following comparative figures for Apple and Google. Key Figures Net income (in millions) Cash dividends declared per common share Common shares outstanding (in millions) Weighted-average common shares outstanding (in millions) Market value (price) per share Equity applicable to common shares (in millions) Required: Apple $ 55,256 $ 3.00 4,443.236 4,617.834 $ 293.65 $ 90,488 Google $ 34,343 - $ 688.335 692.539 $ 1,339.39 $ 201,442 1. Compute the basic earnings per share (EPS) for each company using these data. 2. Compute the dividend yield for each company using these data. 3. Compute the price-earnings ratio for each company using these data. 4. Based on the price-earnings (PE) ratio, for which company do investors have greater expectations about future performance? Complete this question by entering your answers in the tabs below. Required 1 Required 2 Required 3 Required 4 Compute the basic EPS for each company using these data. (Round your answers to 2 decimal places.) Basic EPS Apple Google Required 1 Required 2 >
Step by Step Solution
There are 3 Steps involved in it

Get step-by-step solutions from verified subject matter experts