

Question: AA 5-3 Global Analysis LO A3 Key figures for Samsung follow. W millions Inventory Current Year Cost of sales # 24,983,355 #129,290,661 One Year
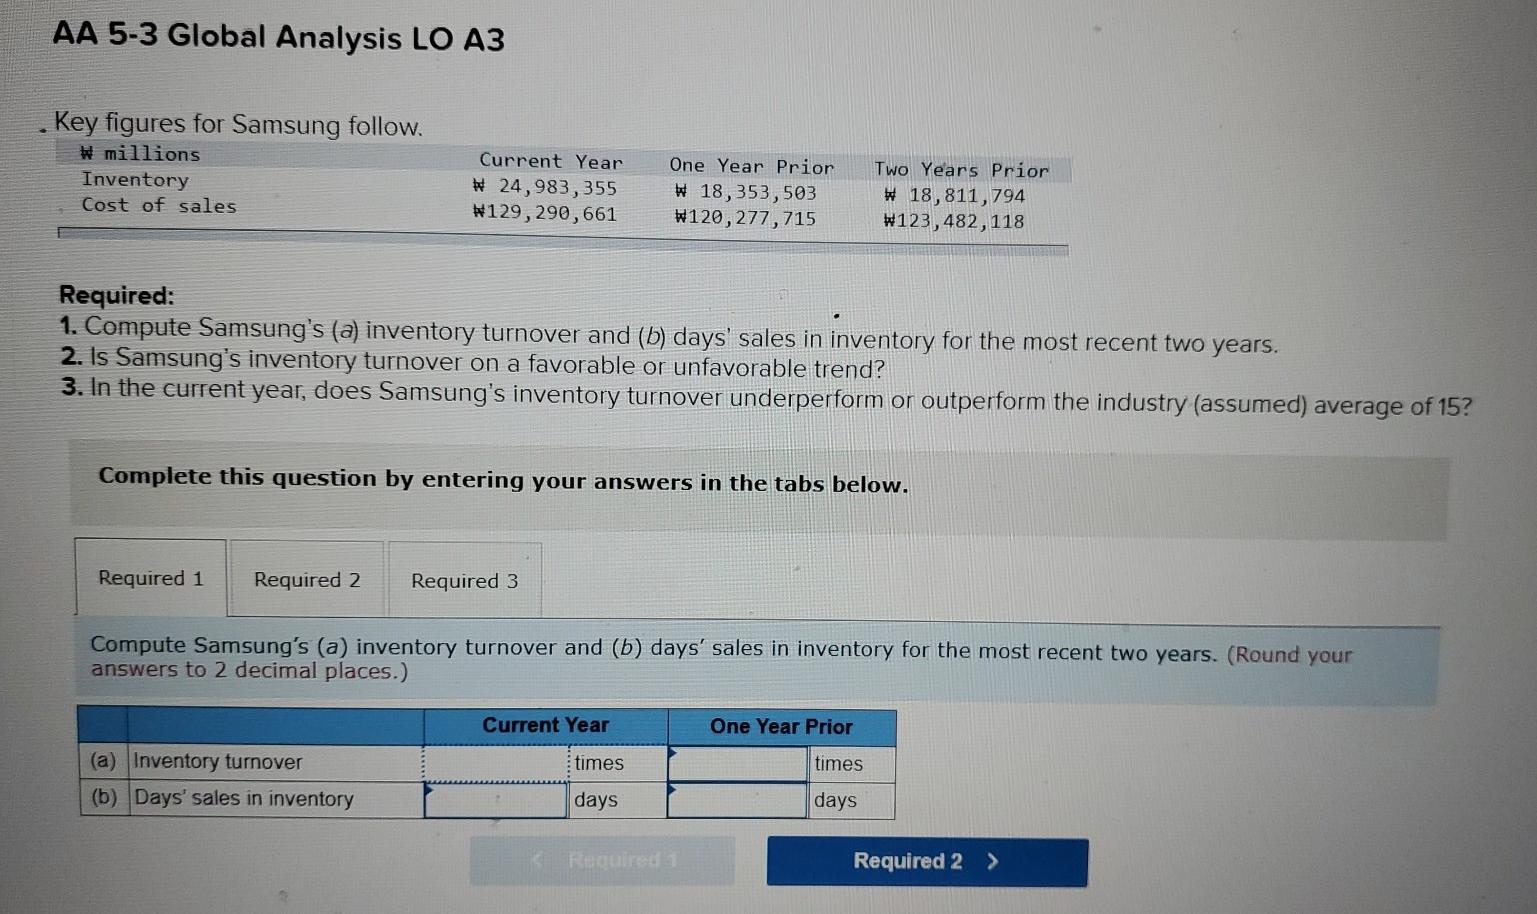
AA 5-3 Global Analysis LO A3 Key figures for Samsung follow. W millions Inventory Current Year Cost of sales # 24,983,355 #129,290,661 One Year Prior # 18,353,503 #120, 277,715 Two Years Prior # 18,811,794 #123,482,118 Required: 1. Compute Samsung's (a) inventory turnover and (b) days' sales in inventory for the most recent two years. 2. Is Samsung's inventory turnover on a favorable or unfavorable trend? 3. In the current year, does Samsung's inventory turnover underperform or outperform the industry (assumed) average of 15? Complete this question by entering your answers in the tabs below. Required 1 Required 2 Required 3 Compute Samsung's (a) inventory turnover and (b) days' sales in inventory for the most recent two years. (Round your answers to 2 decimal places.) (a) Inventory turnover (b) Days' sales in inventory Current Year times One Year Prior times days days Required 1 Required 2 >
Step by Step Solution
There are 3 Steps involved in it

Get step-by-step solutions from verified subject matter experts