

Question: AAA Files Paragraph Styles E Voice Sensitivity Editor Reuse Files A scatterplot of students ACT scores and College GPA was created. Use this to answer
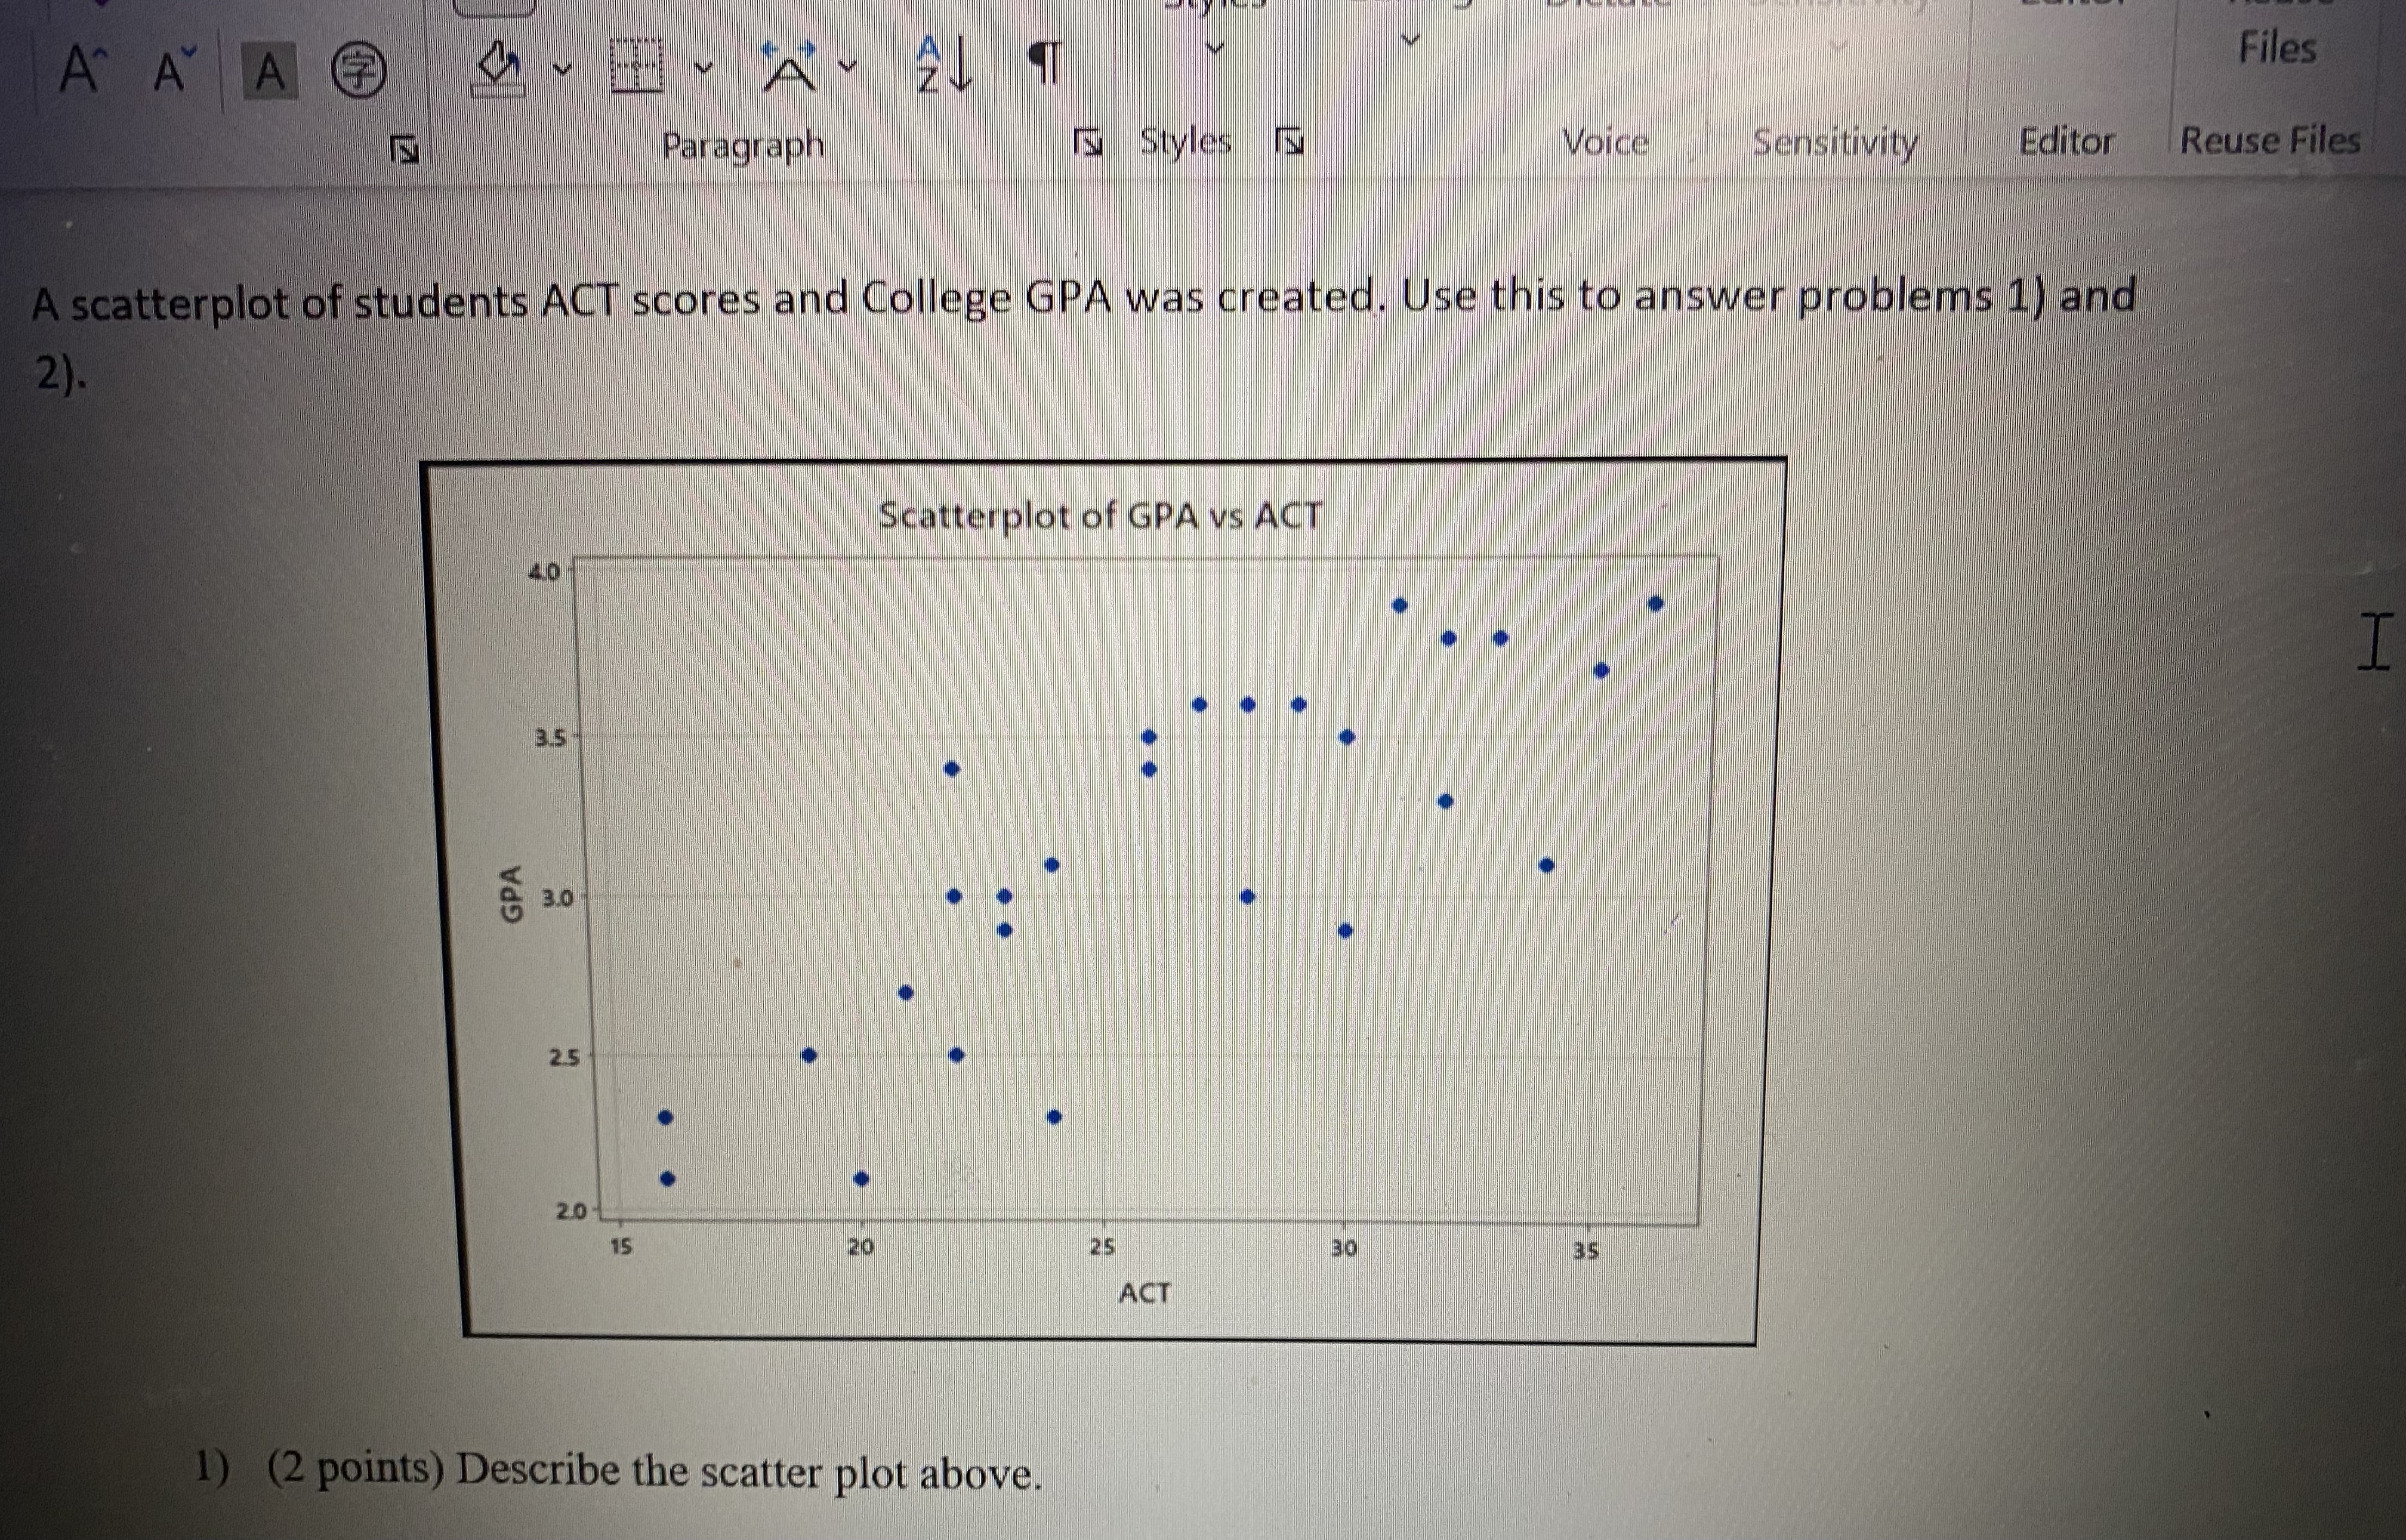
AAA Files Paragraph Styles E Voice Sensitivity Editor Reuse Files A scatterplot of students ACT scores and College GPA was created. Use this to answer problems 1) and 2) Scatterplot of GPA vs ACT 3.5 GPA 3.0 25 20 15 25 30 ACT 1) (2 points) Describe the scatter plot above.aved to this PC Search (Alt+Q) Choi, Matt Minkyu CM In Layout References Mailings Review View Help 11 abc A O LO ab X , x 2 Styles Editing Dictate Sensitivity Editor Reuse A ~ Aav AAA A T Files Font Paragraph Is Styles Voice Sensitivity Editor Reuse Files 2) (1 point) The correlation coefficient value, r, is likely greater than 0, less than 0 or approximately equal to 0. 3) (3 points) The following regression equation was fit using Minitab and the R-squared was found to be 63.7%. GPA - 1.044 + 0.0794 ACT a) (2 points) Interpret the slope and R-squared in context of the problem. b) (1 point) Predict the college GPA of a student with a 33 ACT. 4) (2 points) Circle the correct answer for each question: a) For the normal density curve, the median is (greater than, equal to, less than) the mean. b) Even if two values are from different normal distributions, we still can compare them by using Z-scores. (True, False) 5) (2 points) Math SAT scores are approximately normal with mean 520 and standard deviation 1 12. A college program will offer scholarships to students with Math SAT scores in the top 2.5%. What is the cut-off score for the scholarships? Focus Lo sh (United States) Text Predictions: On Accessibility: Investigate e D w ENG
Step by Step Solution
There are 3 Steps involved in it

Get step-by-step solutions from verified subject matter experts