

Question: AARP reported on a study conducted to learn how long it takes individuals to prepare their federal income tax return (AARP Bulletin, April 2008). The
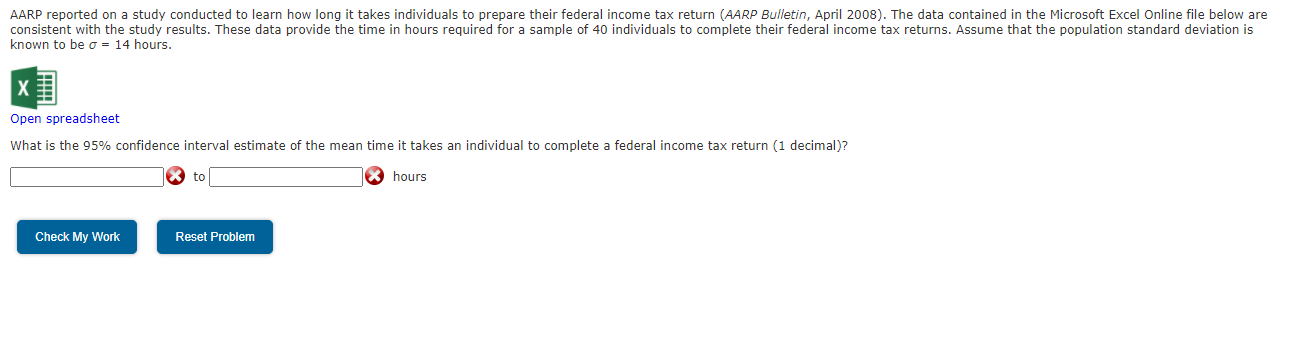
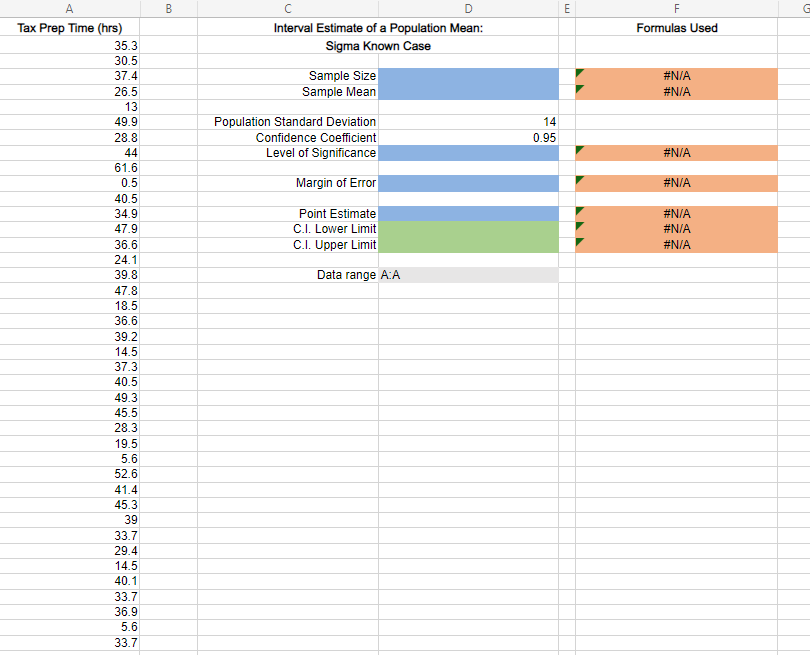
AARP reported on a study conducted to learn how long it takes individuals to prepare their federal income tax return (AARP Bulletin, April 2008). The data contained in the Microsoft Excel Online file below are consistent with the study results. These data provide the time in hours required for a sample of 40 individuals to complete their federal income tax returns. Assume that the population standard deviation is known to be o = 14 hours. Open spreadsheet What is the 95% confidence interval estimate of the mean time it takes an individual to complete a federal income tax return (1 decimal)? to hours Check My Work Reset Problem B E F Formulas Used Interval Estimate of a Population Mean: Sigma Known Case Sample Size Sample Mean #N/A #N/A Population Standard Deviation Confidence Coefficient Level of Significance 14 0.95 #N/A Margin of Error #N/A Point Estimate C.I. Lower Limit C.I. Upper Limit #N/A #N/A #N/A Data range A:A A Tax Prep Time (hrs) 35.3 30.5 37.4 26.5 13 49.9 28.8 44 61.6 0.5 40.5 34.9 47.9 36.6 24.1 39.8 47.8 18.5 36.6 39.2 14.5 37.3 40.5 49.3 45.5 28.3 19.5 5.6 52.6 41.4 45.3 39 33.7 29.4 14.5 40.1 33.7 36.9 5.6 33.7 . AARP reported on a study conducted to learn how long it takes individuals to prepare their federal income tax return (AARP Bulletin, April 2008). The data contained in the Microsoft Excel Online file below are consistent with the study results. These data provide the time in hours required for a sample of 40 individuals to complete their federal income tax returns. Assume that the population standard deviation is known to be o = 14 hours. Open spreadsheet What is the 95% confidence interval estimate of the mean time it takes an individual to complete a federal income tax return (1 decimal)? to hours Check My Work Reset Problem B E F Formulas Used Interval Estimate of a Population Mean: Sigma Known Case Sample Size Sample Mean #N/A #N/A Population Standard Deviation Confidence Coefficient Level of Significance 14 0.95 #N/A Margin of Error #N/A Point Estimate C.I. Lower Limit C.I. Upper Limit #N/A #N/A #N/A Data range A:A A Tax Prep Time (hrs) 35.3 30.5 37.4 26.5 13 49.9 28.8 44 61.6 0.5 40.5 34.9 47.9 36.6 24.1 39.8 47.8 18.5 36.6 39.2 14.5 37.3 40.5 49.3 45.5 28.3 19.5 5.6 52.6 41.4 45.3 39 33.7 29.4 14.5 40.1 33.7 36.9 5.6 33.7
Step by Step Solution
There are 3 Steps involved in it

Get step-by-step solutions from verified subject matter experts