Question: Aay AaBbCcDdEe AaBbCcDdE Body Copy BT IncorrectFee. Main Project Norm +35 21 AaBbCcDE ACBb AaBbC ADA- 5. Madhu has also created two scenarios in the
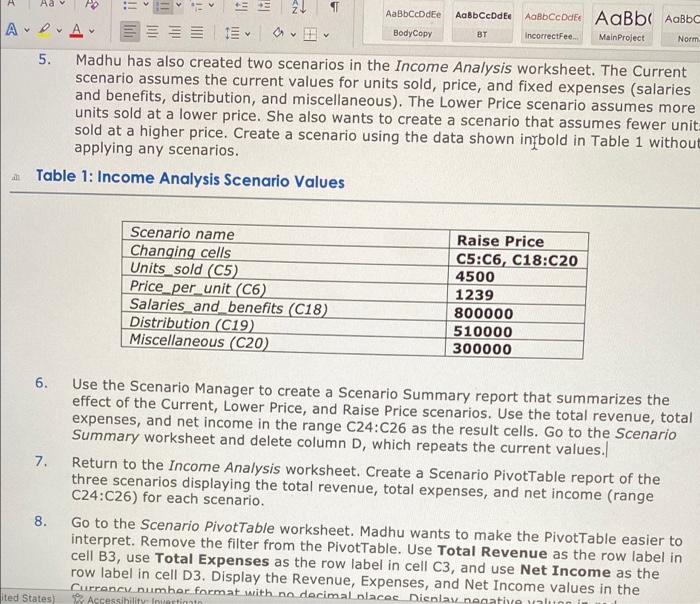
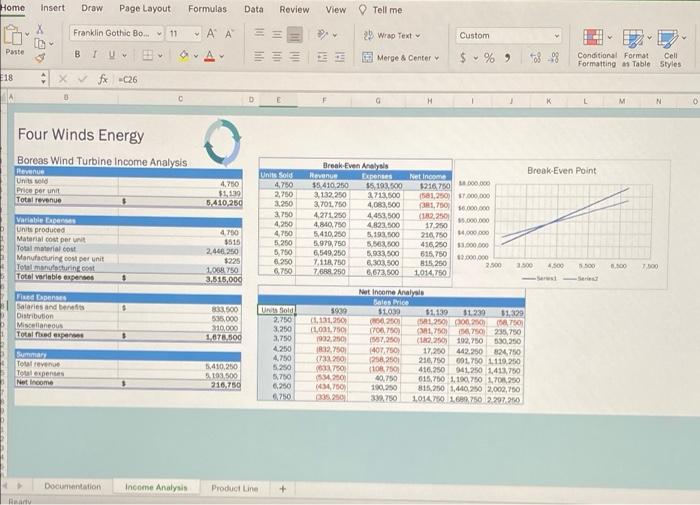
Aay AaBbCcDdEe AaBbCcDdE Body Copy BT IncorrectFee. Main Project Norm +35 21 AaBbCcDE ACBb AaBbC ADA- 5. Madhu has also created two scenarios in the Income Analysis worksheet. The Current scenario assumes the current values for units sold, price, and fixed expenses (salaries and benefits, distribution, and miscellaneous). The Lower Price scenario assumes more units sold at a lower price. She also wants to create a scenario that assumes fewer unit sold at a higher price. Create a scenario using the data shown inrbold in Table 1 without applying any scenarios. Table 1: Income Analysis Scenario Values Scenario name Changing cells Units sold (C5) Price_per_unit (C6) Salaries and benefits (C18) Distribution (C19) Miscellaneous (C20) Raise Price C5:06, C18:C20 4500 1239 800000 510000 300000 6. 7. Use the Scenario Manager to create a Scenario Summary report that summarizes the effect of the Current, Lower Price, and Raise Price scenarios. Use the total revenue, total expenses, and net income in the range C24:C26 as the result cells. Go to the Scenario Summary worksheet and delete column D, which repeats the current values. Return to the Income Analysis worksheet. Create a Scenario PivotTable report of the three scenarios displaying the total revenue, total expenses, and net income (range C24:C26) for each scenario. Go to the Scenario Pivot Table worksheet. Madhu wants to make the PivotTable easier to interpret. Remove the filter from the Pivottable. Use Total Revenue as the row label in cell B3, use Total Expenses as the row label in cell C3, and use Net Income as the row label in cell D3. Display the Revenue, Expenses, and Net Income values in the Currencvnumber format with no decimal places Display negative yang Accessibility Investinato 8. ited States) Home Insert Draw Page Layout Formulas Data Review View Tell me X Franklin Gothic Bo... 11 - A A == 2 Custom Paste 2 Wrap Text Merge & Center B TU $ % Conditional Format Cell Formatting Table Styles 18 Xfx C26 A 0 E G H K M N O Four Winds Energy Break-Even Point Boreas Wind Turbine Income Analysis Revenue Units sold Price per unit Total revenue Net Income $216 750 1.000.000 4,750 31,139 5.410.250 11581,250) 17.000.000 1.750 000 Units Solu 4.750 2,750 3.250 3.750 4,250 4.750 5.250 5.750 6.250 6.750 Break Even Analysis Revenue Expenses 15 410,250 $5,193,500 3.132.250 2713.500 3.701.750 4,083.500 4.271.250 4,453,500 4.810.750 4.823.500 5,410,250 5.193.500 5,979,750 5.503,500 6,549,250 5,933.500 7,118,750 6.303.500 7688 250 6,673,500 Variable con Units produced Materials per unit Total material cost Manufacturing com per unit Total minuturing.com Total variable expenses 1.000.000 10000 (122,250 17.250 210.750 456,250 515,750 15.250 1,014,750 4.700 $515 2.466.250 $225 1,068.750 3.515,000 62.000.000 2.500 2500 2500 1500 100 7.500 Feed Dapenas Salaries and be Distribution Miscellaneous Total fried Gapenas 3.500 $35.000 310,000 1,076,500 Un Sold) 2.750 3.250 3,750 4250 4.750 5250 5750 6,250 0.750 599 (1,131,300 (1.001.750 1992,250 1892.750 4722 200 SO 2500 1634,750) 0520 Net Income Analysis Boleslice $1.000 $1,130 31.230 31.329 000 2000 (541.25010000 700.750 1,750) 7235,750 1557,2500 ( 1.250) 192,750 530.250 407,750 17,200 42.250 824.750 (258,2501 216,750 001.750 1110.250 (TOR 7501 416.250 941.250 1.413.750 0.750 015.750 1.100.750 1,70,250 100.250 815,200 1,440 250 2.002.750 37750 1,014 1.682750 2.297.2009 Tout revenue Total pentas Net Income 5.410,250 103,500 210.750 Documentation Income Analysis Product Line R