

Abbott Laboratories (ABT) engages in the discovery, development, manufacture, and sale of a line of health...
Fantastic news! We've Found the answer you've been seeking!
Question:
Transcribed Image Text:
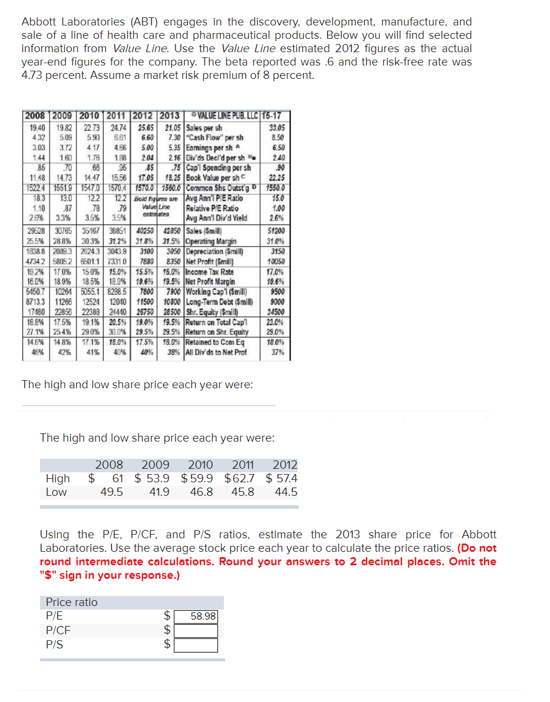
Abbott Laboratories (ABT) engages in the discovery, development, manufacture, and sale of a line of health care and pharmaceutical products. Below you will find selected information from Value Line. Use the Value Line estimated 2012 figures as the actual year-end figures for the company. The beta reported was .6 and the risk-free rate was 4.73 percent. Assume a market risk premium of 8 percent. 2008 2009 2010 2011 2012 2013 VALUE LINE PUB. LLC 16-17 19.40 19.82 22.73 24.74 25.65 21.05 Sales per sh 33.05 432 5.09 5.90 661 6.60 7.30 "Cash Flow" per sh 8.50 303 372 417 456 5.00 5.35 Earnings per sh 6.50 144 160 176 188 204 2.16 Div'ds Deel'd per sh 240 86 70 68 36 85 .75 Cap Spending per sh 90 11.48 14.73 14.47 15.56 17.05 18.25 Book Value per sh 22.25 15224 1551.9 1547.0 183 13.0 122 1.10 87 78 .79 2.6% 33% 3.5% 3.5% 1570.4 1570.0 1560.0 Common Shs Outst1550.0 122 Boid Free are Avg Ann' PE Ratio 15.0 Valine Relative PE Ratio 1.00 Avg Ann Div'd Yield 2.6% 29628 30765 35167 38851 40250 25.5% 28.8% 30.3% 31.2% 31% 18088 20893 2624.3 30439 47342 58052 6501.1 73310 19.2% 170% 15.0% 15.0% 16.0 % 18.9% 18.5% 18.0% 5450.7 10264 5055.1 6296.5 42850 Sales (Smil 31.5% Operating Margin 51200 31.0% 3100 3050 Depreciation (mil) 3150 7880 8350 Net Profit (Smil 10050 15.5% 16.0% Income Tax Rate 17.0% 19.6% 19.5% Net Profit Margin 19.6% 7800 7900 Working Cap1 (mil) 9500 8713.3 11266 12524 17480 22856 22388 24440 12010 11500 10800 Long-Term Debt (mil) 9000 26750 28500 Shr. Equity Smil 34500 18.8% 17.5% 19.1 % 20.5% 27.1% 254% 29 0% 30.0% 29.5% 14.6% 14.8% 17.1% 18.0% 17.5% 48% 42% 41% 40% 40% 19.0% 19.5% Return on Total Cap 23.0% 29.5% Return on Shr. Equity 25.0% 18.0% Retained to Com Eq 18.0% 39% All Div ds to Net Prof 37% The high and low share price each year were: The high and low share price each year were: High Low 2008 2009 2010 2011 2012 $ 61 $ 53.9 $59.9 $62.7 $57.4 49.5 41.9 46.8 45.8 44.5 Using the P/E, P/CF, and P/S ratios, estimate the 2013 share price for Abbott Laboratories. Use the average stock price each year to calculate the price ratios. (Do not round intermediate calculations. Round your answers to 2 decimal places. Omit the "$" sign in your response.) Price ratio P/E P/CF P/S 555 58.98 Abbott Laboratories (ABT) engages in the discovery, development, manufacture, and sale of a line of health care and pharmaceutical products. Below you will find selected information from Value Line. Use the Value Line estimated 2012 figures as the actual year-end figures for the company. The beta reported was .6 and the risk-free rate was 4.73 percent. Assume a market risk premium of 8 percent. 2008 2009 2010 2011 2012 2013 VALUE LINE PUB. LLC 16-17 19.40 19.82 22.73 24.74 25.65 21.05 Sales per sh 33.05 432 5.09 5.90 661 6.60 7.30 "Cash Flow" per sh 8.50 303 372 417 456 5.00 5.35 Earnings per sh 6.50 144 160 176 188 204 2.16 Div'ds Deel'd per sh 240 86 70 68 36 85 .75 Cap Spending per sh 90 11.48 14.73 14.47 15.56 17.05 18.25 Book Value per sh 22.25 15224 1551.9 1547.0 183 13.0 122 1.10 87 78 .79 2.6% 33% 3.5% 3.5% 1570.4 1570.0 1560.0 Common Shs Outst1550.0 122 Boid Free are Avg Ann' PE Ratio 15.0 Valine Relative PE Ratio 1.00 Avg Ann Div'd Yield 2.6% 29628 30765 35167 38851 40250 25.5% 28.8% 30.3% 31.2% 31% 18088 20893 2624.3 30439 47342 58052 6501.1 73310 19.2% 170% 15.0% 15.0% 16.0 % 18.9% 18.5% 18.0% 5450.7 10264 5055.1 6296.5 42850 Sales (Smil 31.5% Operating Margin 51200 31.0% 3100 3050 Depreciation (mil) 3150 7880 8350 Net Profit (Smil 10050 15.5% 16.0% Income Tax Rate 17.0% 19.6% 19.5% Net Profit Margin 19.6% 7800 7900 Working Cap1 (mil) 9500 8713.3 11266 12524 17480 22856 22388 24440 12010 11500 10800 Long-Term Debt (mil) 9000 26750 28500 Shr. Equity Smil 34500 18.8% 17.5% 19.1 % 20.5% 27.1% 254% 29 0% 30.0% 29.5% 14.6% 14.8% 17.1% 18.0% 17.5% 48% 42% 41% 40% 40% 19.0% 19.5% Return on Total Cap 23.0% 29.5% Return on Shr. Equity 25.0% 18.0% Retained to Com Eq 18.0% 39% All Div ds to Net Prof 37% The high and low share price each year were: The high and low share price each year were: High Low 2008 2009 2010 2011 2012 $ 61 $ 53.9 $59.9 $62.7 $57.4 49.5 41.9 46.8 45.8 44.5 Using the P/E, P/CF, and P/S ratios, estimate the 2013 share price for Abbott Laboratories. Use the average stock price each year to calculate the price ratios. (Do not round intermediate calculations. Round your answers to 2 decimal places. Omit the "$" sign in your response.) Price ratio P/E P/CF P/S 555 58.98
Expert Answer:

Posted Date:
Students also viewed these finance questions
-
1. What is the present value (PV") of an offer of $15,000 two years from now if the Opportunity Cost of Capital (OCC) is $12% per annum? 2. What is the PV of an offer to receive $12,000 three years...
-
What are the probability limits of (1/n) LM, where LM is defined in (13-31) under the null hypothesis that 2 u = 0 and under the alternative that 2u 0?
-
If someone had paid $5 for a call with E = $37, and the stock was selling for $40 at termination of the call, what would be this person's profit on the call? a. -$5 b. -$2 c. $2 d. $3
-
The Tramot Corporation has $2,000,000 of 6 percent bonds outstanding. There is $40,000 of unamortized discount remaining on the bonds after the March 1, 20x6, semiannual interest payment. The bonds...
-
The following schedule shows the amounts related to supplies that a city debited and credited to the indicated accounts during a year (not necessarily the year-end balances), excluding closing...
-
Question 1 Bugie Uganda Limited (BUL) manufactures and supplies paint. However, there is stiff competition in the paint industry. To this effect, the management of BUL continuously develops...
-
The polynomial P(x) = x-6x + 15x-18x + 10 four complex roots. One of them is x=1+i. This immediately tells you another root, namely The other complex roots are: Note: give your answer as a list of...
-
Common stock A has an expected return of 8%, a standard deviation of future returns of 20%, and a beta of 1.2. Common stock B has an expected return of 10%, a standard deviation of future returns of...
-
Part 1: A city has an annual budget of $350,000,000. The assessed value of all the property in the city is $70,000,000,000. Express the tax rate as a percentage. 1. 5 Express the tax rate as an...
-
You have been asked to review an investment analysis of a 10-year project with a big upfront investment of $ 10 million and equal annual after-tax cash flows for the next 10 years. The analyst has...
-
Cigarette Smoking in China On May 1, 2011, the Chinese Government issued a call for no-smoking in 28 public indoor spaces such as offices, restaurants, museums, waiting rooms of train stations, bus...
-
The following are Wyeth Co . s unit costs of making and selling an item at a volume of 1 0 , 0 0 0 units per month: Manufacturing: Direct materials................$ 1 . 0 0 Direct...
-
In the Polaris case, transportation costs were decreased when manufacturing was moved from the northern Midwest to Mexico. Why?
-
The Higher the time period of the financial security the higher the. ............... risk. O a. Maturity O b. Default and Maturity Oc. Default O d. Liquidity
-
Transaction Analysis and Business Activities OBJECTIVE 3 The accountant for Huron Corporation has collected the following information: a. Huron purchased a tract of land from Jacobsen Real Estate for...
-
Transaction Analysis} During December, Cynthiana Refrigeration Service engaged in the following transactions: a. On December 3, Cynthiana sold a one-year service contract to Cub Foods for \(\$ 12 ;...
-
Inferring Transactions from Statement of Financial Position Changes Each of the following statement of financial position changes is associated with a particular transaction: YOUDECIDE a. Cash...

Study smarter with the SolutionInn App