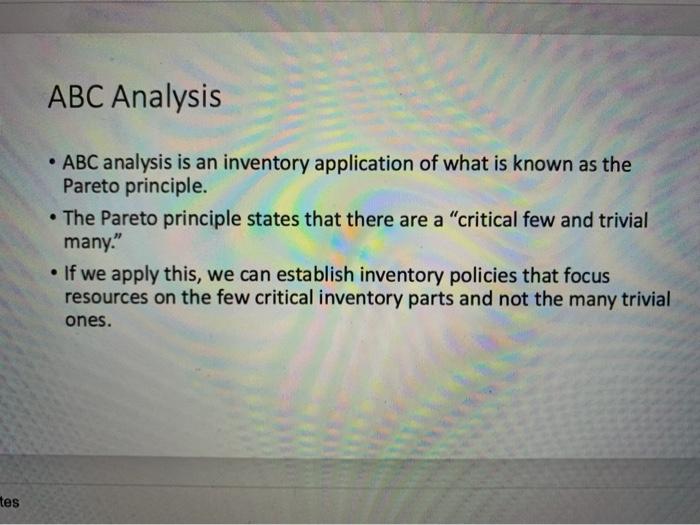
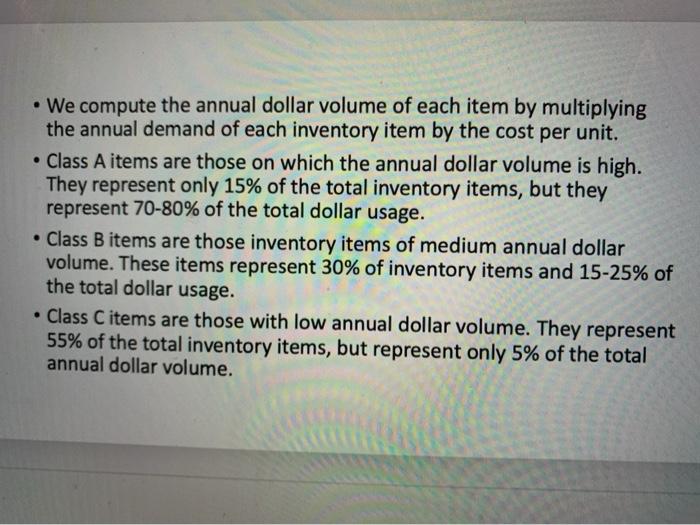
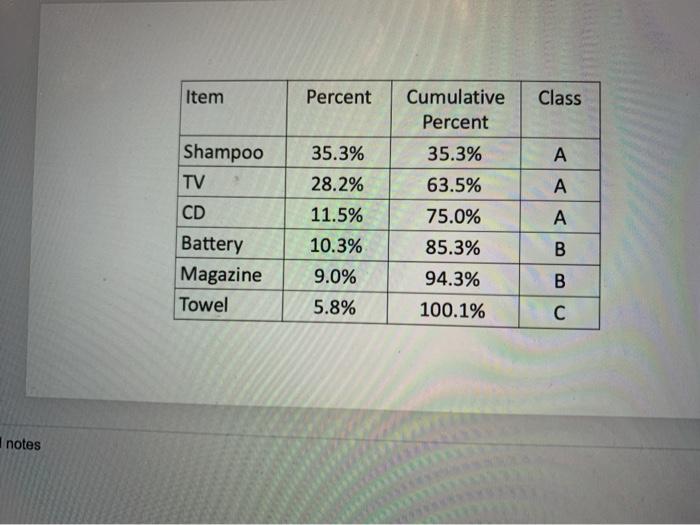
Question: ABC Analysis ABC analysis is an inventory application of what is known as the Pareto principle. The Pareto principle states that there are a critical

ABC Analysis ABC analysis is an inventory
ABC Analysis ABC analysis is an inventory application of what is known as the Pareto principle. The Pareto principle states that there are a "critical few and trivial many." If we apply this, we can establish inventory policies that focus resources on the few critical inventory parts and not the many trivial ones. tes Pareto Charts 80% Cumulative Wealth 20% People from the richest to the poorest otes 95% 80% Cumulative Wealth 20% 50% tes tes Cumulative Annual Dollar Volume Inventory Items We compute the annual dollar volume of each item by multiplying the annual demand of each inventory item by the cost per unit. . Class A items are those on which the annual dollar volume is high. They represent only 15% of the total inventory items, but they represent 70-80% of the total dollar usage. Class B items are those inventory items of medium annual dollar volume. These items represent 30% of inventory items and 15-25% of the total dollar usage. Class C items are those with low annual dollar volume. They represent 55% of the total inventory items, but represent only 5% of the total annual dollar volume. Close monitor? Inventory group Dollar usage (%) Inventory items (%) 70 10 Yes B 20 20 In some cases C 10 70 No Advantages? Examples: a Walmart store, a massage shop, multiple responsibilities at work Cost per Example . Consider a Walmart store with the following items on the shelf. Classify the first 75% of the annual dollar usage as A, the next 19.3% as B, and the rest as C. Item Annual Annual Cost Percent Unit ($) Demand CD 6 400 Shampoo 5 1100 Towel 1 900 TV 55 80 Magazine 2 700 Battery 800 N notes Item Cost per Annual Cost Percent CD Annual Unit ($) Demand 6 400 5 1100 1 900 Shampoo Towel TV Magazine Battery 1800/15600=11.5% 35.3% 5.8% 28.2% 9.0% 10.3% 55 (6)(300)=1800 5500 900 4400 1400 1600 Total = 15,600 80 2 2 700 800 2 d notes Item Percent Class A Shampoo TV CD Battery Magazine Towel 35.3% 28.2% 11.5% 10.3% 9.0% 5.8% Cumulative Percent 35.3% 63.5% 75.0% 85.3% 94.3% 100.1% A B B notes Insert Convert to SmartArt Drawing X, AV ABC Analysis: The Procedure Step 1: Compute the annual dollar volume for each item, which is (Unit Cost)x(Annual Demand) Step 2: Compute the total annual dollar volume. Step 3: Compute the percentage of the annual dollar volume. Step 4: Sort the items in increasing order of the percentages. Step 5: Classify the items into A, B, and C. notes Exercises Classify the first 70.2% of the annual dollar usage as A, the next 17.5% as B, and the rest as C. . ITEM Unit Cost ($) Annual Demand 1 5 200 N 10 400 3 2 100 4 6 30 4 80 d notes

Step by Step Solution

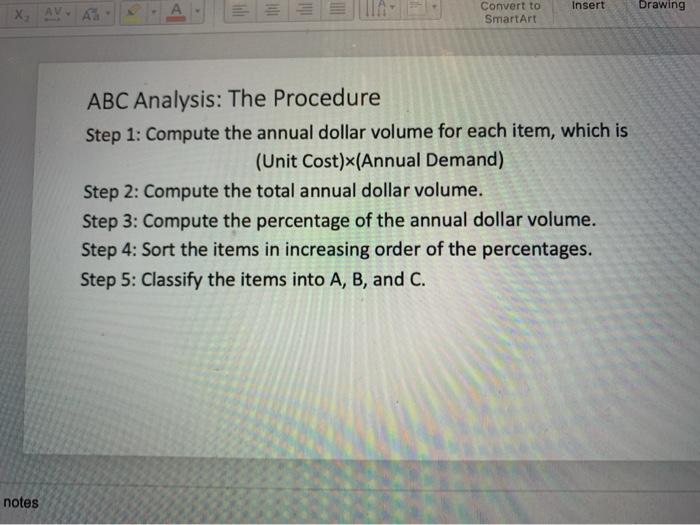
There are 3 Steps involved in it

1 Expert Approved Answer
Step: 1 Unlock blur-text-image
Question Has Been Solved by an Expert!

Get step-by-step solutions from verified subject matter experts

Step: 2 Unlock
Step: 3 Unlock

Students Have Also Explored These Related General Management Questions!