

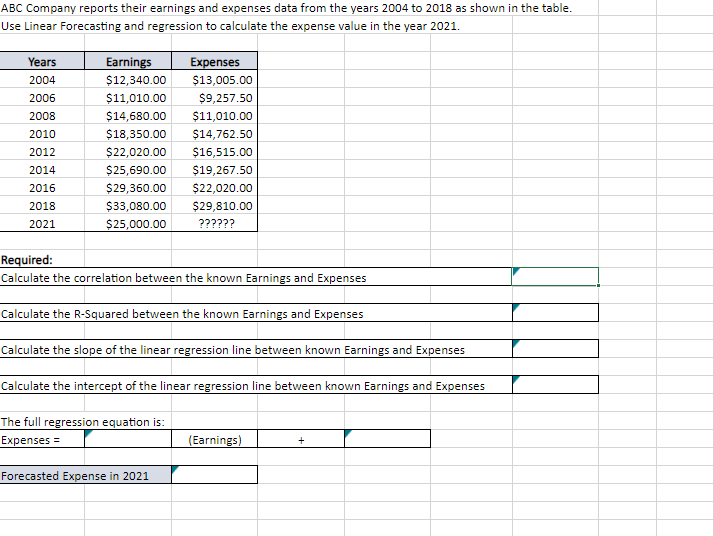
ABC Company reports their earnings and expenses data from the years 2004 to 2018 as shown...
Fantastic news! We've Found the answer you've been seeking!
Question:
Expert Answer:

Related Book For 

Business Statistics A Decision Making Approach
ISBN: 9780133021844
9th Edition
Authors: David F. Groebner, Patrick W. Shannon, Phillip C. Fry
Posted Date:
