

Question: Abnormal returns ($12.3) The second column in Table 12.2 @ shows the monthly return on the British FTSE 100 index from January 2015 through July
Abnormal returns ($12.3) The second column in Table 12.2 @ shows the monthly return on the British FTSE 100 index from January 2015 through July 2017. The remaining columns show returns on the stocks of two firms Executive Cheese and Paddington Beer. Both firms announced their earnings in July 2017. The earnings of one of these stocks slightly disappointed investors and the earnings of the other were slightly better than expected. Which was which?
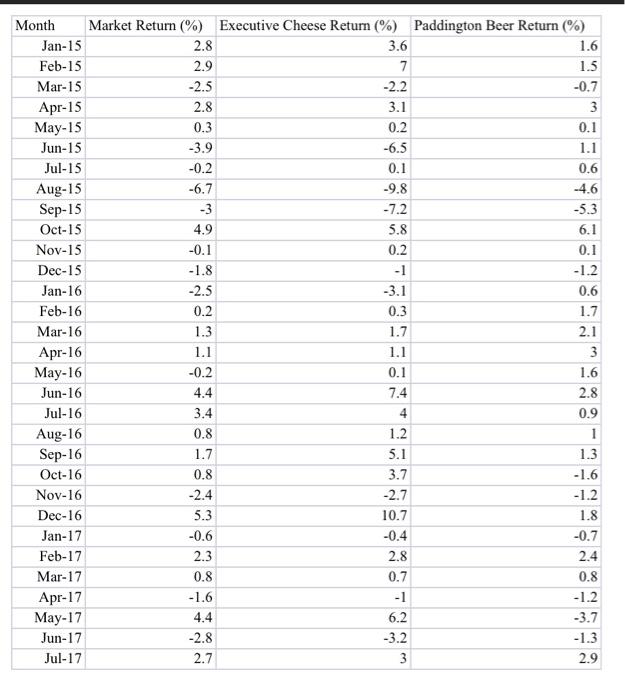
\begin{tabular}{|r|r|r|r|r|} \hline Month & Market Return (\%) & Executive Cheese Return (\%) & Paddington Beer Return (\%) \\ \hline Jan-15 & 2.8 & 3.6 & 1.6 \\ \hline Feb-15 & 2.9 & 7 & 1.5 \\ \hline Mar-15 & -2.5 & -2.2 & -0.7 \\ \hline Apr-15 & 2.8 & 3.1 & 3 \\ \hline May-15 & 0.3 & 0.2 & 0.1 \\ \hline Jun-15 & -3.9 & -6.5 & 1.1 \\ \hline Jul-15 & -0.2 & 0.1 & 0.6 \\ \hline Aug-15 & -6.7 & -9.8 & -4.6 \\ \hline Sep-15 & -3 & -7.2 & -5.3 \\ \hline Oct-15 & 4.9 & 5.8 & 6.1 \\ \hline Nov-15 & -0.1 & 0.2 & 0.1 \\ \hline Dec-15 & -1.8 & -1 & -1.2 \\ \hline Jan-16 & -2.5 & -3.1 & 0.6 \\ \hline Feb-16 & 0.2 & 0.3 & 1.7 \\ \hline Mar-16 & 1.3 & 1.7 & 2.1 \\ \hline Apr-16 & 1.1 & 1.1 & 3 \\ \hline May-16 & -0.2 & 0.1 & 1.6 \\ \hline Jun-16 & 4.4 & 7.4 & 2.8 \\ \hline Jul-16 & 3.4 & 4 & 0.9 \\ \hline Aug-16 & 0.8 & 1.2 & 1 \\ \hline Sep-16 & 1.7 & 5.1 & 1.3 \\ \hline Oct-16 & 0.8 & 3.7 & -1.6 \\ \hline Nov-16 & -2.4 & -2.7 & -1.2 \\ \hline Dec-16 & 5.3 & 10.7 & 1.8 \\ \hline Jan-17 & -0.6 & -0.4 & -0.7 \\ \hline Feb-17 & 2.3 & 2.8 & 2.4 \\ \hline Mar-17 & 0.8 & 0.7 & 0.8 \\ \hline Apr-17 & -1.6 & -1 & -1.2 \\ \hline May-17 & 4.4 & 6.2 & -3.7 \\ \hline Jun-17 & -2.8 & 3.2 & -1.3 \\ \hline Jul-17 & 2.7 & 2.9 \\ \hline \end{tabular}
Step by Step Solution
There are 3 Steps involved in it

Get step-by-step solutions from verified subject matter experts