

Question: above is an example below is different question Fiure 2. Amnunt of the EITC for an Unmarried Tax Filer with One Child. 2018 Revenue Code
above is an example
below is different question 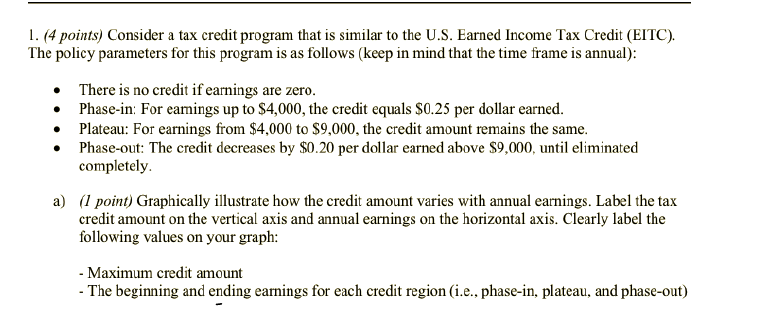
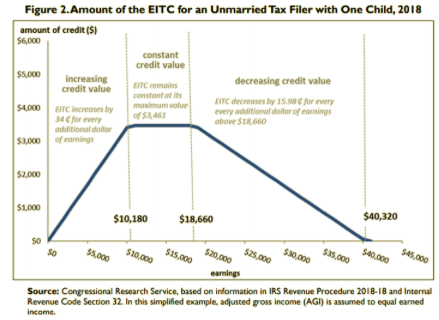
Fiure 2. Amnunt of the EITC for an Unmarried Tax Filer with One Child. 2018 Revenue Code Section 32. In this simplified example, adjusted gross income (AGI) is assumed to equal earned income. 1. (4 points) Consider a tax credit program that is similar to the U.S. Earned Income Tax Credit (EITC). The policy parameters for this program is as follows (keep in mind that the time frame is annual): - There is no credit if earnings are zero. - Phase-in: For eamings up to $4,000, the credit equals $0.25 per dollar earned. - Plateau: For earnings from $4,000 to $9,000, the credit amount remains the same. - Phase-out: The credit decreases by $0.20 per dollar earned above $9,000, until eliminated completely. a) (1 point) Graphically illustrate how the credit amount varies with annual earnings. Label the tax credit amount on the vertical axis and annual earnings on the horizontal axis. Clearly label the following values on your graph: - Maximum credit amount - The beginning and ending earnings for each credit region (i.e., phase-in, plateau, and phase-out) Fiure 2. Amnunt of the EITC for an Unmarried Tax Filer with One Child. 2018 Revenue Code Section 32. In this simplified example, adjusted gross income (AGI) is assumed to equal earned income. 1. (4 points) Consider a tax credit program that is similar to the U.S. Earned Income Tax Credit (EITC). The policy parameters for this program is as follows (keep in mind that the time frame is annual): - There is no credit if earnings are zero. - Phase-in: For eamings up to $4,000, the credit equals $0.25 per dollar earned. - Plateau: For earnings from $4,000 to $9,000, the credit amount remains the same. - Phase-out: The credit decreases by $0.20 per dollar earned above $9,000, until eliminated completely. a) (1 point) Graphically illustrate how the credit amount varies with annual earnings. Label the tax credit amount on the vertical axis and annual earnings on the horizontal axis. Clearly label the following values on your graph: - Maximum credit amount - The beginning and ending earnings for each credit region (i.e., phase-in, plateau, and phase-out)
Step by Step Solution
There are 3 Steps involved in it

Get step-by-step solutions from verified subject matter experts