

Question: Above table shows recent project completion times ( days ) along with their difficulty level. The difficulty levels are indicated by A , Band C
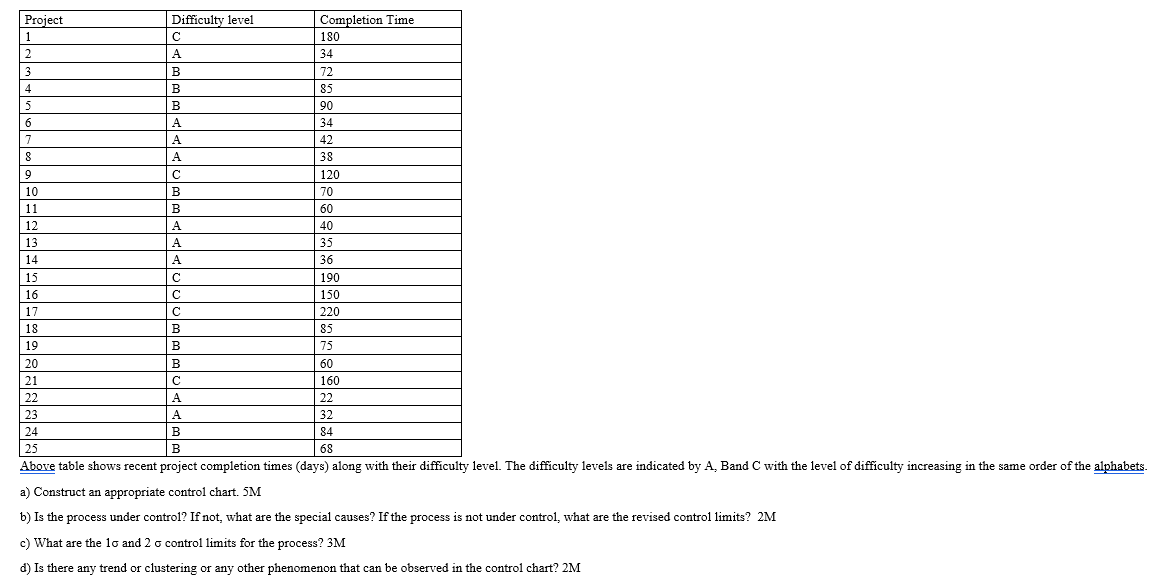
Above table shows recent project completion times days along with their difficulty level. The difficulty levels are indicated by A Band C with the level of difficulty increasing in the same order of the alphabets.
a Construct an appropriate control chart. M
b Is the process under control? If not, what are the special causes? If the process is not under control, what are the revised control limits M
c What are the sigma and sigma control limits for the process? M
d Is there any trend or clustering or any other phenomenon that can be observed in the control chart? M
Step by Step Solution
There are 3 Steps involved in it
1 Expert Approved Answer
Step: 1 Unlock

Question Has Been Solved by an Expert!
Get step-by-step solutions from verified subject matter experts
Step: 2 Unlock
Step: 3 Unlock