

Question: AC Apps C 0 . YouTube 2 Individual Assignment#2 (2).pdf Individual Assignment#2 (2).pdf x Maps 9 M Gmail New Tab File C:/Users/13sia/Downloads/Individual%20Assignment%22%20(2).pdf Individual Assignment#2 (HUMA
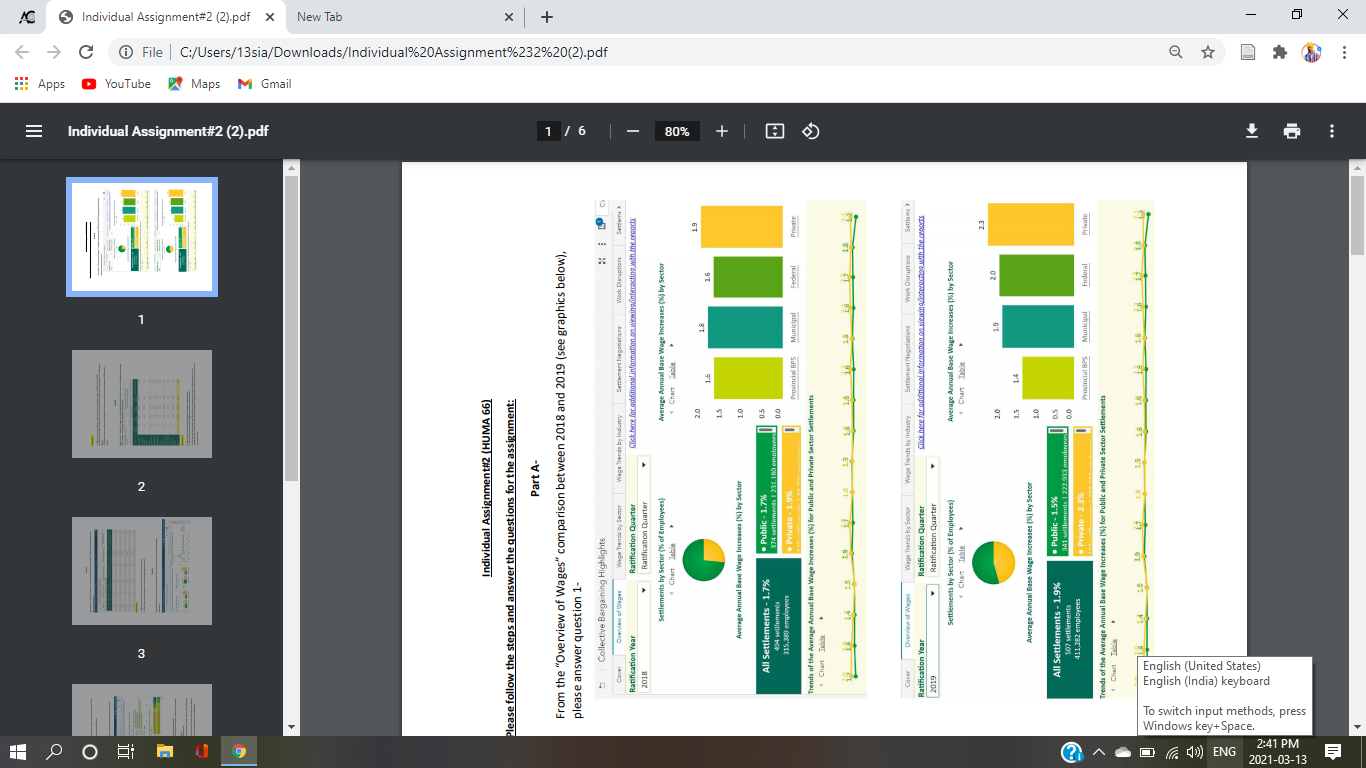
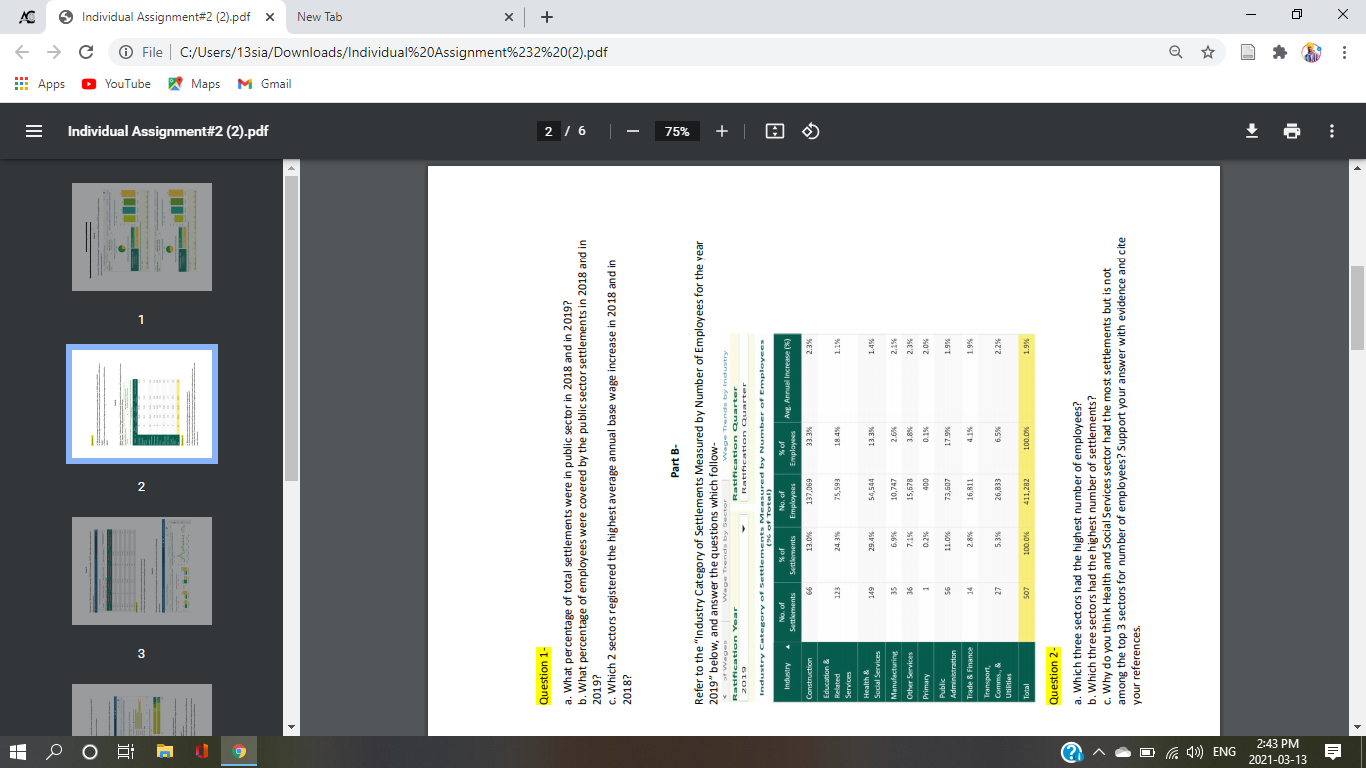
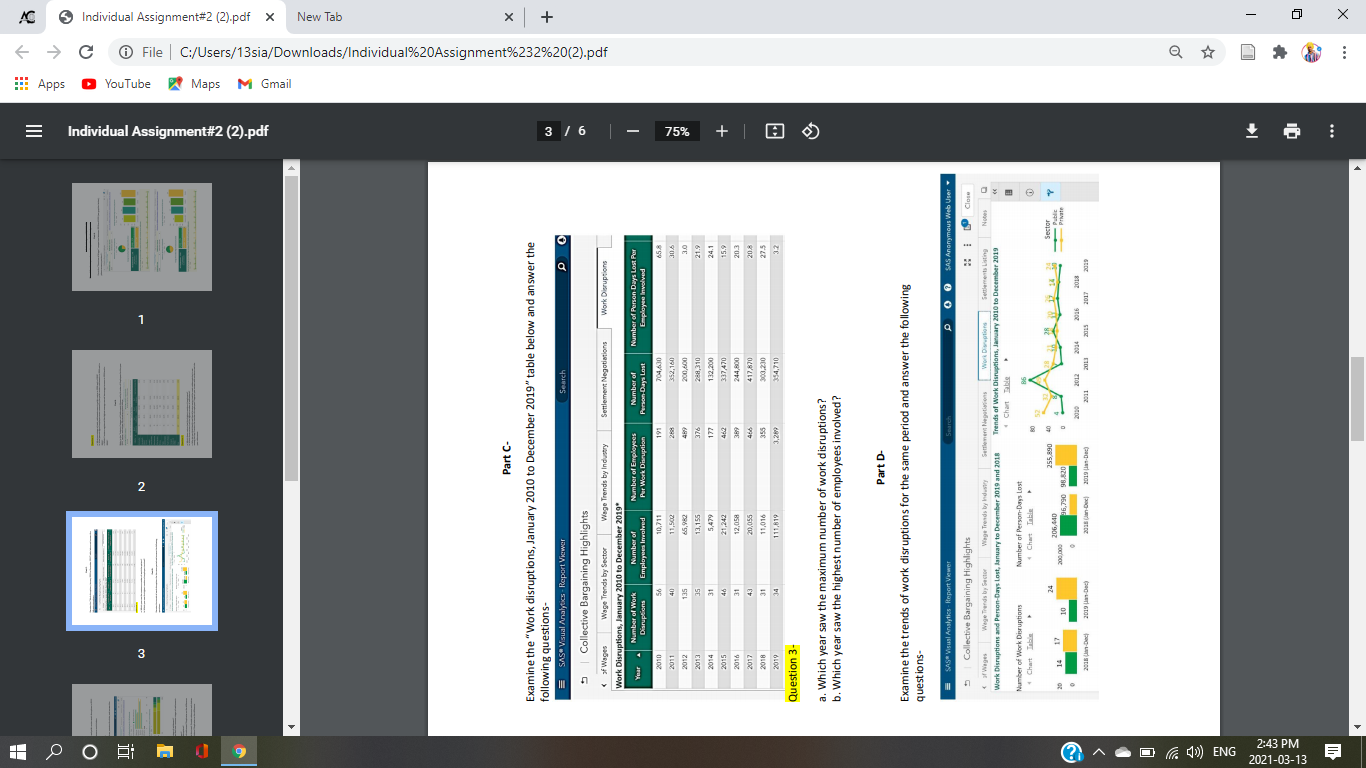
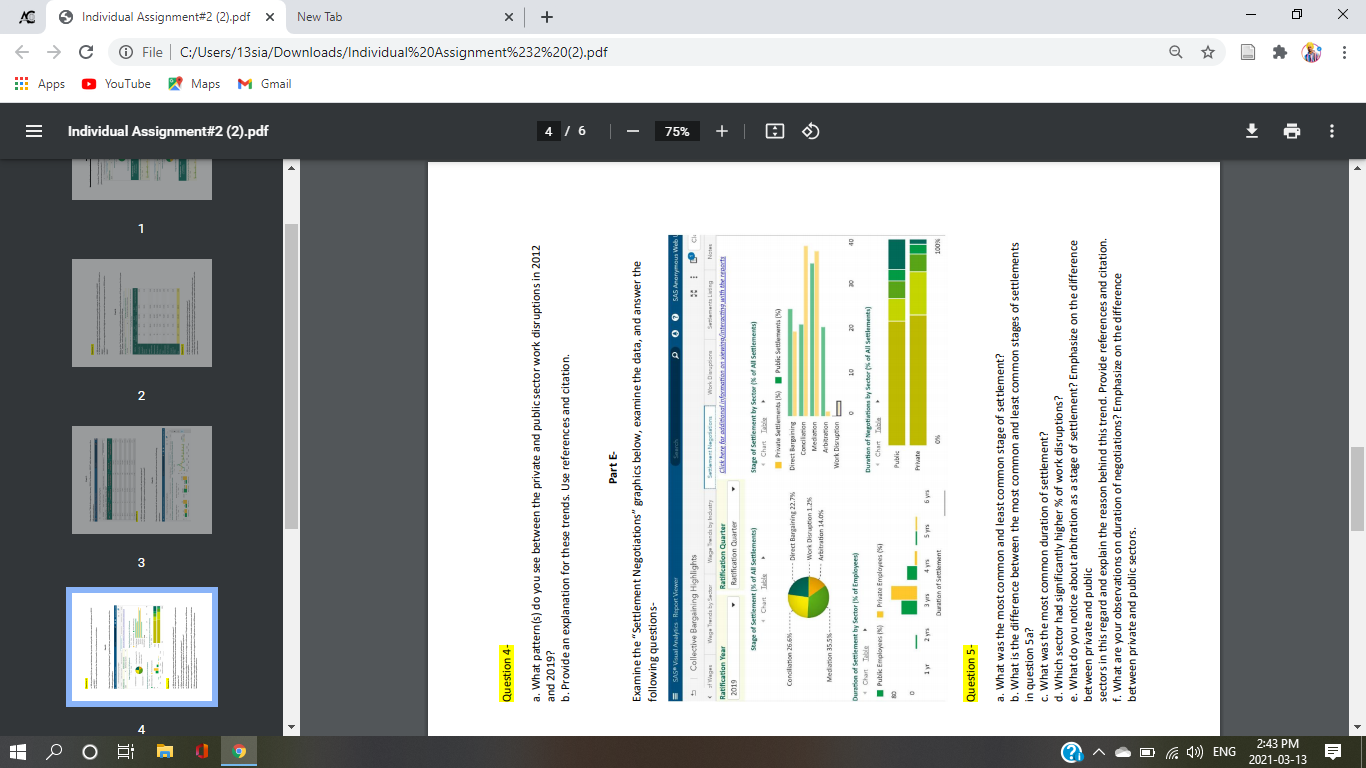
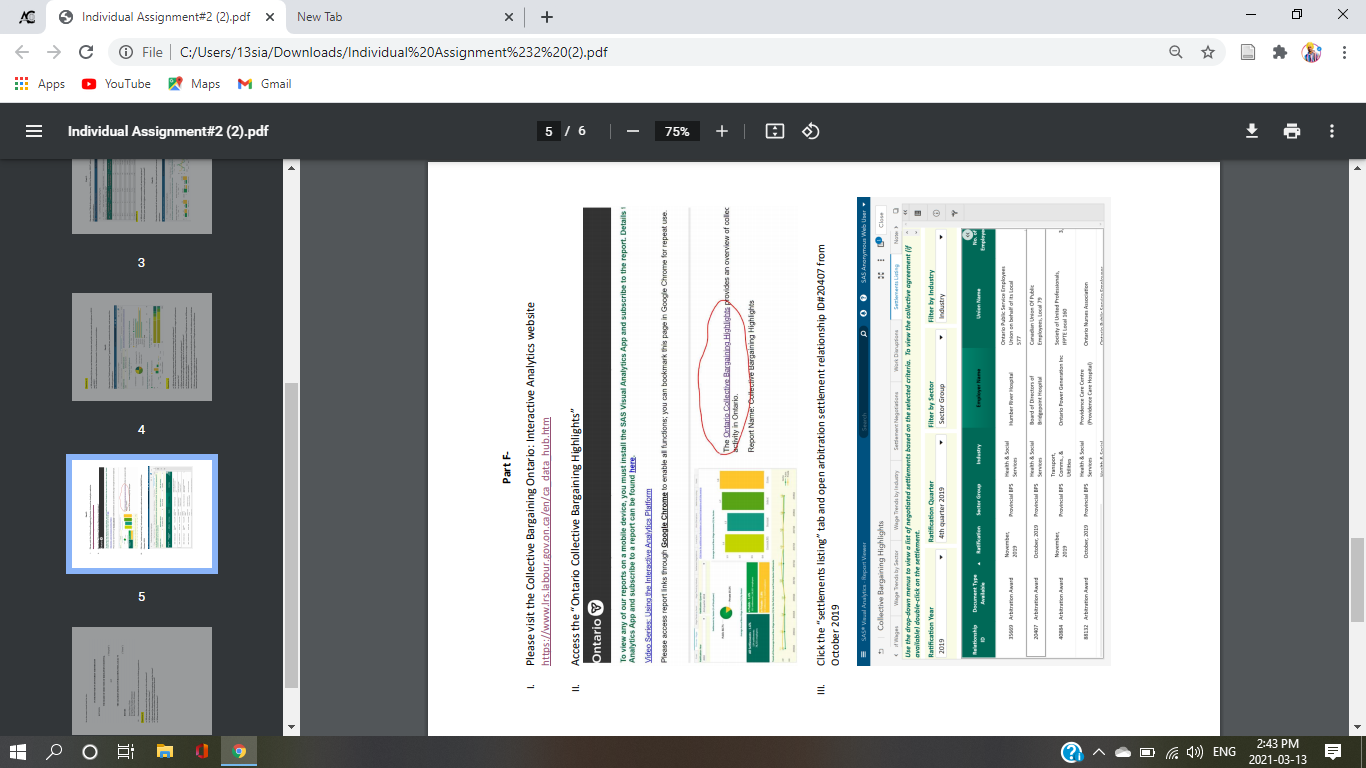
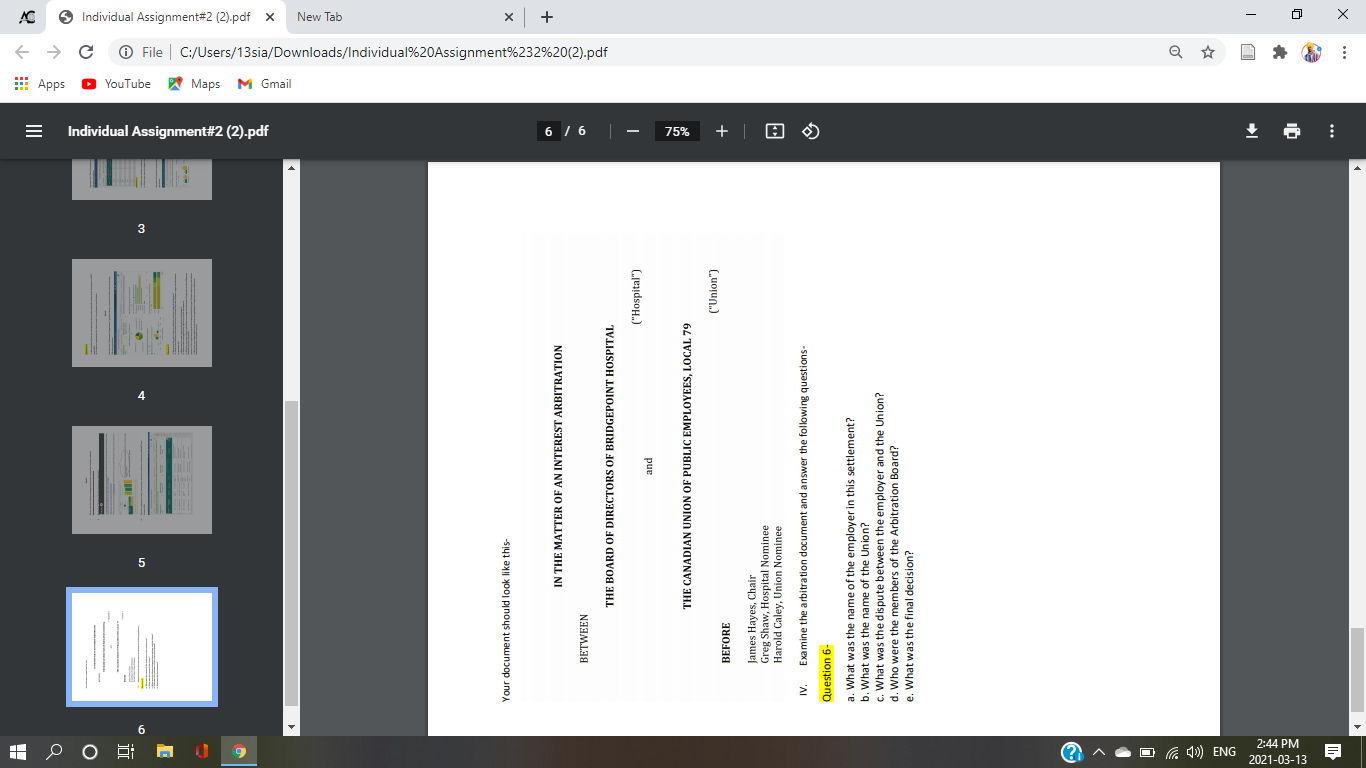
AC Apps C 0 . YouTube 2 Individual Assignment#2 (2).pdf Individual Assignment#2 (2).pdf x Maps 9 M Gmail New Tab File C:/Users/13sia/Downloads/Individual%20Assignment%22%20(2).pdf Individual Assignment#2 (HUMA 66) Please follow the steps and answer the questions for the assignment: Part A- + 1 / 6 From the "Overview of Wages" comparison between 2018 and 2019 (see graphics below), please answer question 1. Collective Bargaining Highlights Derview at Viage Wage Trunde Ratification Quarter Settlements by Sector of Employees Sverige Annual Base Wape Increases (0) by Sector %08 + werage Annual Base Wape Increases (%) by Sector All Settlements - 1.7% Public - 1.7% Ratification Year Ratification Quarter meats by Sector is member Settlements by Sertable Chor Tablete wage increases (13) by See All Settlements - 1.9% . Public - 1.5% 41.3mments Private - 2.33 rovincial BS Municipal Federal mual Base Wage Increases (4) for Public and Private sector Settlements la ENG Windows key+Space. To switch input methods, press 2021-03-13 2:41 PM English (India) keyboard English (United States) I ... 1 1 OOR = Individual Assignment#2 (2).pdf Apps YouTube Maps M Gmail c File | C:/Users/13sia/Downloads/Individual%20Assignment%22%20(2).pdf Individual Assignment#2 (2).pdf * New Tab X Question 1- 2 / 6 a. What percentage of total settlements were in public sector in 2018 and in 2019? b. What percentage of employees were covered by the public sector settlements in 2018 and in 2019? c. Which 2 sectors registered the highest average annual base wage increase in 2018 and in 2018? Part B- 75% + Refer to the "Industry Category of Settlements Measured by Number of Employees for the year 2019" below, and answer the questions which follow- Wage Trends by industry Ratication Year Ratification Quarter 2019 (96 of Total) Industry Category of Settlements Measured by Number of employees Industry No. of No. of % of Settlements Settlements Employees Employees Avg. Annual Increase (%) Construction 13.0% 137,069 33.3% 2.3% Education & Related 24.3% 75,593 18.4% 1.1% Services Health & Social Services 149 29.4% 54,544 13.3% 1.4% Manufacturing 6.9% 2.6% 2.15 10,747 15,578 36 7.1% 3.8% 2.05 Other Services Primary Public Administration 56 11.0% 73,607 1.9% Trade & Finance 2.8% 16,811 1.9% Iransport, comm,& Utilities 27 5.3% 26,833 6.5% 2.2% Total SOT 100.0% 411,282 100.0% 1.9% Question 2- a. Which three sectors had the highest number of employees? b. Which three sectors had the highest number of settlements ? c. Why do you think Health and Social Services sector had the most settlements but is not among the top 3 sectors for number of employees? Support your answer with evidence and cite your references. ? 4 ENG 2:43 PM 1 2021-03-13 1 ! O = Individual Assignment#2 (2).pdf AC Individual A Apps YouTube Maps M Gmail dual Assignment#2 (2).pdf * New Tab c File C:/Users/13sia/Downloads/Individual%20Assignment%22%20(2).pdf X Part C- Examine the "Work disruptions, January 2010 to December 2019" table below and answer the following questions- E SASVisual Analytics - Report Viewer Search P Collective Bargaining Highlights 3 / 6 3 Settlement Negotiations Work Disruptions Number of Person Days Lost 704630 Number of Person Days Lost Por Employee involved 65.8 sf Wages Wage Trends by Sector Wage Trends by Industry Work Disruptions, January 2010 to December 2019 Number of Work Number of Tuar Number of Employees Disruption Employees Involved Pur Work Disruption 10,711 2011 40 11,50 2012 135 , 982 489 2013 13,155 376 2014 177 21,242 2016 51 12,658 2017 43 20,055 466 31 11.016 2019 111,819 30.5 3.0 21.9 - 75% + 200,600 288,310 132,200 337,470 244,800 417.870 300.230 354.710 15.9 203 20.8 27.5 32 Question 3- a. Which year saw the maximum number of work disruptions? b. Which year saw the highest number of employees involved? Part D- Examine the trends of work disruptions for the same period and answer the following questions- E SAS Visual Analytics Report Viewer po SAS Anonymous Web User Collective Bargaining Highlights Wiges Wege Trends by to Wage Trends by Industry Work Disruptions and Person-Days Lost, Kanuary to December 2019 and 2018 Work wions Trends of Work Disruptions, January 2010 to December 2019 Number of Work Duruptions Chart Table Number of Person Days Lost Chart Table 24 206,440 255,890 17 200,000 Private 2016 Dec 2019 Dec nec 2019 -Dach Ora 1.) ENG 2:43 PM 2021-03-13 1 1 . Individual Assignment#2 (2).pdf AC Individual A Apps YouTube Maps M Gmail dual Assignment#2 (2).pdf x New Tab c File | C:/Users/13sia/Downloads/Individual%20Assignment%232%20(2).pdf Question 4- X a. What pattern(s) do you see between the private and public sector work disruptions in 2012 and 2019? b. Provide an explanation for these trends. Use references and citation. 4 / 6 Part 6 Examine the "Settlement Negotiations" graphics below, examine the data, and answer the following questions- SAS Anonymous Web = SAS Visual Analytics Report Viewer Collective Bargaining Highlights Weges WageTrandaby to Wagrande by Industry Ratification Year Ratification Quarter 2019 Ratification Quarter - 75% + Salement Negotiation Work Deruption Click here for additional information viewinter with the Stape of Settlement of All Settlements) Stape of Settlement by Sector of All Settlements) Condition 26.6% Direct Bargaining 22.7% - Work Disruption 1.25 Arbitration 14.0% Private Settlements ) Public Settlements (% Direct Bargaining Concion Mediation Arbitration Work Disruption 20 Mediation 35.5% Duration of Settlement by Sector of Employees) Chart Table Putik Employees IN) Private Employees ( Duration of Negotiations by Sector of All Settlements) Public Private 1 y by 3 yrs Ouation of Settlement Question 5- 3 a. What was the most common and least common stage of settlement? b. What is the difference between the most common and least common stages of settlements in question 5a? c. What was the most common duration of settlement? d. Which sector had significantly higher % of work disruptions? e. What do you notice about arbitration as a stage of settlement? Emphasize on the difference between private and public sectors in this regard and explain the reason behind this trend. Provide references and citation. f. What are your observations on duration of negotiations? Emphasize on the difference between private and public sectors. .O (1) ENG 2:43 PM 2021-03-13 1 AC Apps C 0 YouTube 3 Individual Assignment#2 (2).pdf Individual Assignment#2 (2).pdf x Maps M Gmail New Tab File C:/Users/13sia/Downloads/Individual%20Assignment%22%20(2).pdf Part F- + Please visit the Collective Bargaining Ontario: Interactive Analytics website https://www.lrs.labour.gov.on.ca/en/ca data hub.htm Access the "Ontario Collective Bargaining Highlights" Ontario 5 / 6 ubscribe to the report. Analytics Pop and subscribe to meeport can be found here all the SAS Visual Analytics Video Series: Using the Interactive Analytics Platform Please access report inks through Google Chrome to enable al functions, you 75% + III. Click the "settlements listing" tab and open arbitration settlement relationship ID# 20407 from October 2019 Sector Group Industry la 4)) ENG 2021-03-13 2:43 PM F ... 110 Individual Assignment#2 (2).pdf Apps YouTube Maps M Gmail c File | C:/Users/13sia/Downloads/Individual%20Assignment%22%20(2).pdf 10 Individual Assignment#2 (2).pdf New Tab Your document should look like this- X IN THE MATTER OF AN INTEREST ARBITRATION 9 / 9 BETWEEN THE BOARD OF DIRECTORS OF BRIDGEPOINT HOSPITAL ("Hospital") and - 75% + THE CANADIAN UNION OF PUBLIC EMPLOYEES, LOCAL 79 ("Union") BEFORE James Hayes, Chair Greg Shaw, Hospital Nominee Harold Caley, Union Nominee IV. Examine the arbitration document and answer the following questions- Question 6- a. What was the name of the employer in this settlement? b. What was the name of the Union? c. What was the dispute between the employer and the Union? d. Who were the members of the Arbitration Board? e. What was the final decision? Ora 1.) ENG 2:44 PM 2021-03-13 1 AC Apps C 0 . YouTube 2 Individual Assignment#2 (2).pdf Individual Assignment#2 (2).pdf x Maps 9 M Gmail New Tab File C:/Users/13sia/Downloads/Individual%20Assignment%22%20(2).pdf Individual Assignment#2 (HUMA 66) Please follow the steps and answer the questions for the assignment: Part A- + 1 / 6 From the "Overview of Wages" comparison between 2018 and 2019 (see graphics below), please answer question 1. Collective Bargaining Highlights Derview at Viage Wage Trunde Ratification Quarter Settlements by Sector of Employees Sverige Annual Base Wape Increases (0) by Sector %08 + werage Annual Base Wape Increases (%) by Sector All Settlements - 1.7% Public - 1.7% Ratification Year Ratification Quarter meats by Sector is member Settlements by Sertable Chor Tablete wage increases (13) by See All Settlements - 1.9% . Public - 1.5% 41.3mments Private - 2.33 rovincial BS Municipal Federal mual Base Wage Increases (4) for Public and Private sector Settlements la ENG Windows key+Space. To switch input methods, press 2021-03-13 2:41 PM English (India) keyboard English (United States) I ... 1 1 OOR = Individual Assignment#2 (2).pdf Apps YouTube Maps M Gmail c File | C:/Users/13sia/Downloads/Individual%20Assignment%22%20(2).pdf Individual Assignment#2 (2).pdf * New Tab X Question 1- 2 / 6 a. What percentage of total settlements were in public sector in 2018 and in 2019? b. What percentage of employees were covered by the public sector settlements in 2018 and in 2019? c. Which 2 sectors registered the highest average annual base wage increase in 2018 and in 2018? Part B- 75% + Refer to the "Industry Category of Settlements Measured by Number of Employees for the year 2019" below, and answer the questions which follow- Wage Trends by industry Ratication Year Ratification Quarter 2019 (96 of Total) Industry Category of Settlements Measured by Number of employees Industry No. of No. of % of Settlements Settlements Employees Employees Avg. Annual Increase (%) Construction 13.0% 137,069 33.3% 2.3% Education & Related 24.3% 75,593 18.4% 1.1% Services Health & Social Services 149 29.4% 54,544 13.3% 1.4% Manufacturing 6.9% 2.6% 2.15 10,747 15,578 36 7.1% 3.8% 2.05 Other Services Primary Public Administration 56 11.0% 73,607 1.9% Trade & Finance 2.8% 16,811 1.9% Iransport, comm,& Utilities 27 5.3% 26,833 6.5% 2.2% Total SOT 100.0% 411,282 100.0% 1.9% Question 2- a. Which three sectors had the highest number of employees? b. Which three sectors had the highest number of settlements ? c. Why do you think Health and Social Services sector had the most settlements but is not among the top 3 sectors for number of employees? Support your answer with evidence and cite your references. ? 4 ENG 2:43 PM 1 2021-03-13 1 ! O = Individual Assignment#2 (2).pdf AC Individual A Apps YouTube Maps M Gmail dual Assignment#2 (2).pdf * New Tab c File C:/Users/13sia/Downloads/Individual%20Assignment%22%20(2).pdf X Part C- Examine the "Work disruptions, January 2010 to December 2019" table below and answer the following questions- E SASVisual Analytics - Report Viewer Search P Collective Bargaining Highlights 3 / 6 3 Settlement Negotiations Work Disruptions Number of Person Days Lost 704630 Number of Person Days Lost Por Employee involved 65.8 sf Wages Wage Trends by Sector Wage Trends by Industry Work Disruptions, January 2010 to December 2019 Number of Work Number of Tuar Number of Employees Disruption Employees Involved Pur Work Disruption 10,711 2011 40 11,50 2012 135 , 982 489 2013 13,155 376 2014 177 21,242 2016 51 12,658 2017 43 20,055 466 31 11.016 2019 111,819 30.5 3.0 21.9 - 75% + 200,600 288,310 132,200 337,470 244,800 417.870 300.230 354.710 15.9 203 20.8 27.5 32 Question 3- a. Which year saw the maximum number of work disruptions? b. Which year saw the highest number of employees involved? Part D- Examine the trends of work disruptions for the same period and answer the following questions- E SAS Visual Analytics Report Viewer po SAS Anonymous Web User Collective Bargaining Highlights Wiges Wege Trends by to Wage Trends by Industry Work Disruptions and Person-Days Lost, Kanuary to December 2019 and 2018 Work wions Trends of Work Disruptions, January 2010 to December 2019 Number of Work Duruptions Chart Table Number of Person Days Lost Chart Table 24 206,440 255,890 17 200,000 Private 2016 Dec 2019 Dec nec 2019 -Dach Ora 1.) ENG 2:43 PM 2021-03-13 1 1 . Individual Assignment#2 (2).pdf AC Individual A Apps YouTube Maps M Gmail dual Assignment#2 (2).pdf x New Tab c File | C:/Users/13sia/Downloads/Individual%20Assignment%232%20(2).pdf Question 4- X a. What pattern(s) do you see between the private and public sector work disruptions in 2012 and 2019? b. Provide an explanation for these trends. Use references and citation. 4 / 6 Part 6 Examine the "Settlement Negotiations" graphics below, examine the data, and answer the following questions- SAS Anonymous Web = SAS Visual Analytics Report Viewer Collective Bargaining Highlights Weges WageTrandaby to Wagrande by Industry Ratification Year Ratification Quarter 2019 Ratification Quarter - 75% + Salement Negotiation Work Deruption Click here for additional information viewinter with the Stape of Settlement of All Settlements) Stape of Settlement by Sector of All Settlements) Condition 26.6% Direct Bargaining 22.7% - Work Disruption 1.25 Arbitration 14.0% Private Settlements ) Public Settlements (% Direct Bargaining Concion Mediation Arbitration Work Disruption 20 Mediation 35.5% Duration of Settlement by Sector of Employees) Chart Table Putik Employees IN) Private Employees ( Duration of Negotiations by Sector of All Settlements) Public Private 1 y by 3 yrs Ouation of Settlement Question 5- 3 a. What was the most common and least common stage of settlement? b. What is the difference between the most common and least common stages of settlements in question 5a? c. What was the most common duration of settlement? d. Which sector had significantly higher % of work disruptions? e. What do you notice about arbitration as a stage of settlement? Emphasize on the difference between private and public sectors in this regard and explain the reason behind this trend. Provide references and citation. f. What are your observations on duration of negotiations? Emphasize on the difference between private and public sectors. .O (1) ENG 2:43 PM 2021-03-13 1 AC Apps C 0 YouTube 3 Individual Assignment#2 (2).pdf Individual Assignment#2 (2).pdf x Maps M Gmail New Tab File C:/Users/13sia/Downloads/Individual%20Assignment%22%20(2).pdf Part F- + Please visit the Collective Bargaining Ontario: Interactive Analytics website https://www.lrs.labour.gov.on.ca/en/ca data hub.htm Access the "Ontario Collective Bargaining Highlights" Ontario 5 / 6 ubscribe to the report. Analytics Pop and subscribe to meeport can be found here all the SAS Visual Analytics Video Series: Using the Interactive Analytics Platform Please access report inks through Google Chrome to enable al functions, you 75% + III. Click the "settlements listing" tab and open arbitration settlement relationship ID# 20407 from October 2019 Sector Group Industry la 4)) ENG 2021-03-13 2:43 PM F ... 110 Individual Assignment#2 (2).pdf Apps YouTube Maps M Gmail c File | C:/Users/13sia/Downloads/Individual%20Assignment%22%20(2).pdf 10 Individual Assignment#2 (2).pdf New Tab Your document should look like this- X IN THE MATTER OF AN INTEREST ARBITRATION 9 / 9 BETWEEN THE BOARD OF DIRECTORS OF BRIDGEPOINT HOSPITAL ("Hospital") and - 75% + THE CANADIAN UNION OF PUBLIC EMPLOYEES, LOCAL 79 ("Union") BEFORE James Hayes, Chair Greg Shaw, Hospital Nominee Harold Caley, Union Nominee IV. Examine the arbitration document and answer the following questions- Question 6- a. What was the name of the employer in this settlement? b. What was the name of the Union? c. What was the dispute between the employer and the Union? d. Who were the members of the Arbitration Board? e. What was the final decision? Ora 1.) ENG 2:44 PM 2021-03-13 1
Step by Step Solution
There are 3 Steps involved in it

Get step-by-step solutions from verified subject matter experts