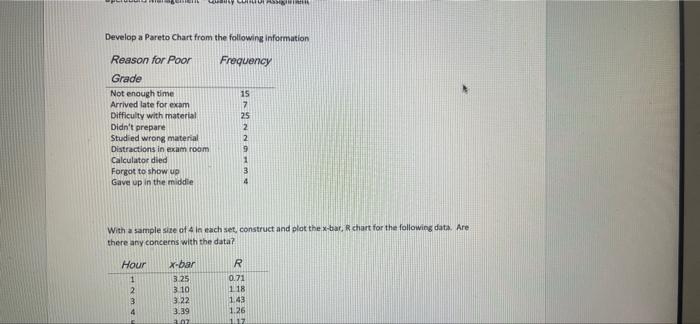
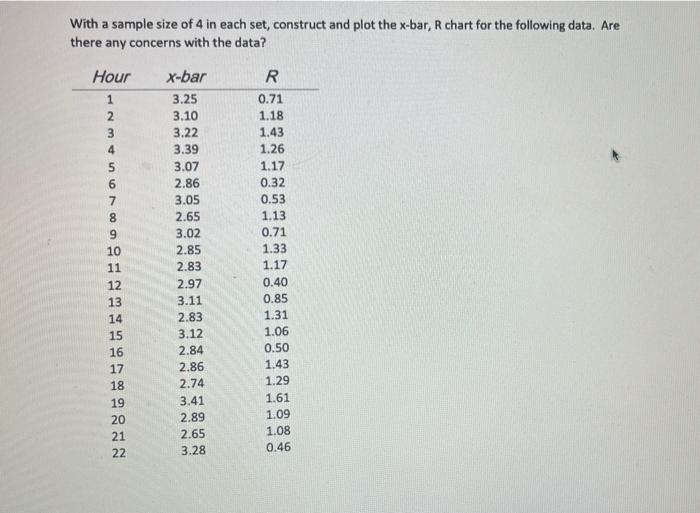
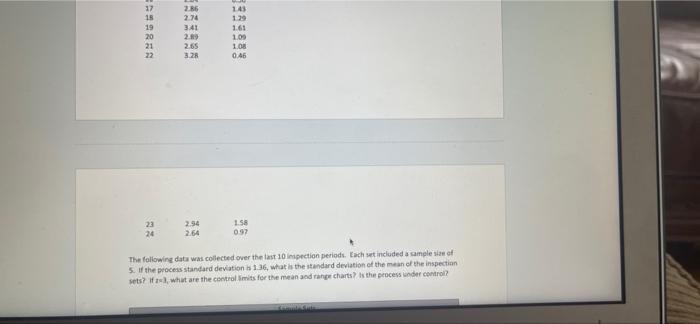
Question: Acc Develop a Pareto Chart from the following information Reason for Poor Frequency Grade Not enough time Arrived late for exam Difficulty with material Didn't

Acc Develop a Pareto Chart from the following
Acc Develop a Pareto Chart from the following information Reason for Poor Frequency Grade Not enough time Arrived late for exam Difficulty with material Didn't prepare Studied wrong material Distractions in exam room Calculator died Forgot to show up Gave up in the middle Hour 1 2 3 4 BUY CLARIDA ASH&TMA With a sample size of 4 in each set, construct and plot the x-bar, R chart for the following data. Are there any concerns with the data? x-bar 3.25 3.10 3.22 3.39 2.02 15 7 25 2 NNGAMA R 0.71 118 1.43 1.26 117 With a sample size of 4 in each set, construct and plot the x-bar, R chart for the following data. Are there any concerns with the data? Hour 123456 745680 10 11 12 13 14 15 16 17 589272 18 19 20 21 x-bar 3.25 3.10 3.22 3.39 3.07 2.86 3.05 2.65 3.02 2.85 2.83 2.97 3.11 2.83 3.12 2.84 2.86 2.74 3.41 2.89 2.65 3.28 R 0.71 1.18 1.43 1.26 1.17 0.32 0.53 1.13 0.71 1.33 1.17 0.40 0.85 1.31 1.06 0.50 1.43 1.29 1.61 1.09 1.08 0.46 17 18 19 20 21 22 23 24 2.86 2.74 3.41 2.89 2.65 3.28 2.54 2.64 1.43 1.29 1.61 1.09 1.08 0.46 1.58 0.97 The following data was collected over the last 10 inspection periods. Each set included a sample size of 5. If the process standard deviation is 1.36, what is the standard deviation of the mean of the inspection sets? If 2-3, what are the control limits for the mean and range charts? Is the process under control? Come Cate

Step by Step Solution

There are 3 Steps involved in it

1 Expert Approved Answer
Step: 1 Unlock blur-text-image
Question Has Been Solved by an Expert!

Get step-by-step solutions from verified subject matter experts

Step: 2 Unlock
Step: 3 Unlock

Students Have Also Explored These Related General Management Questions!