

Question: Acceleration due to gravity Weighting: 5% Marks: 25 Purpose: Science: Past, Present, and Future LAB #3 1. To illustrate the uncertainty of a measurement
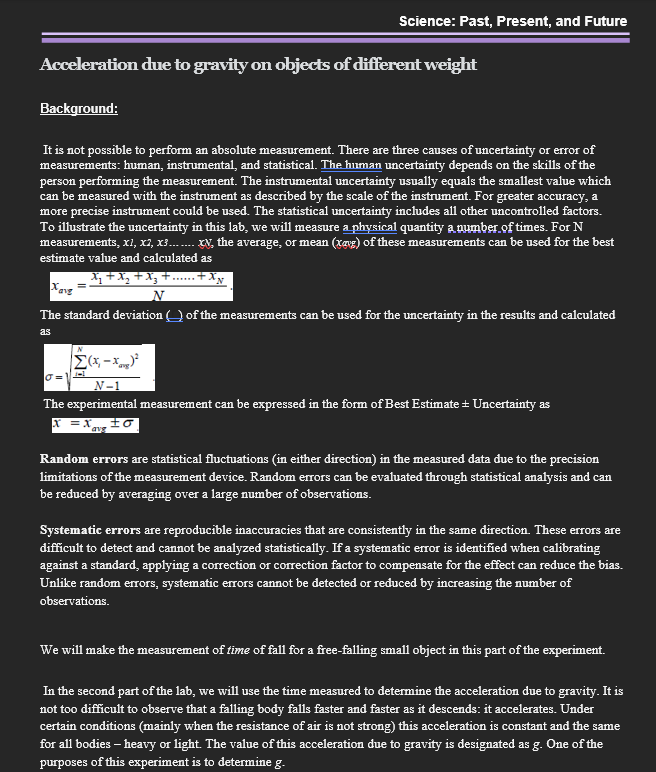
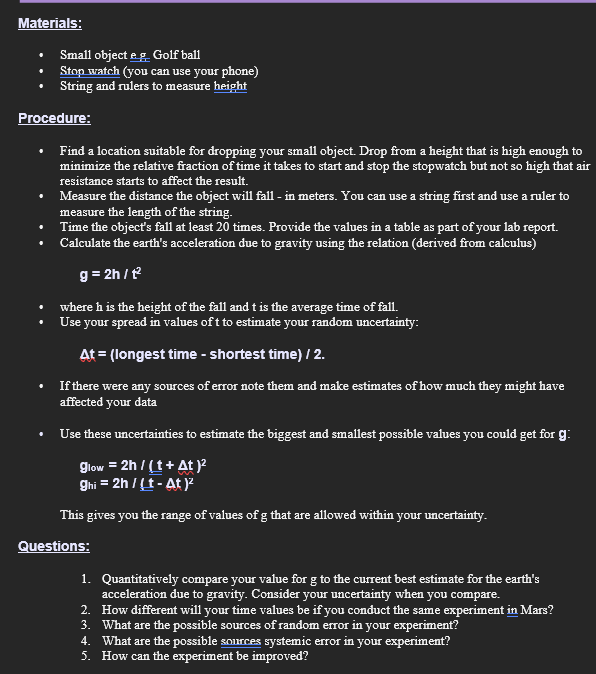
Acceleration due to gravity Weighting: 5% Marks: 25 Purpose: Science: Past, Present, and Future LAB #3 1. To illustrate the uncertainty of a measurement and estimating the best value 2. To determine the acceleration due to gravity Instructions: 1. This assessment will be completed at home individually or with help of family member. 2. You will follow the lab procedure indicated. 4. You will have until the deadline to complete the Lab. 5. Answer all questions. Marking Criteria: The components of the procedure will be marked as follows. Express non-numerical responses using complete sentences. Component Data Collection and presentation Data Analysis Calculations Marks 15 /10 Logical Analysis of errors 15 Discussion: Answers to all questions. 15 Total /25 Science: Past, Present, and Future Acceleration due to gravity on objects of different weight Background: It is not possible to perform an absolute measurement. There are three causes of uncertainty or error of measurements: human, instrumental, and statistical. The human uncertainty depends on the skills of the person performing the measurement. The instrumental uncertainty usually equals the smallest value which can be measured with the instrument as described by the scale of the instrument. For greater accuracy, a more precise instrument could be used. The statistical uncertainty includes all other uncontrolled factors. To illustrate the uncertainty in this lab, we will measure a physical quantity a number of times. For N measurements, x1, x2, x3....... xy, the average, or mean (xog) of these measurements can be used for the best estimate value and calculated as X +X +Xz + ......+Xx N The standard deviation (of the measurements can be used for the uncertainty in the results and calculated as N - N-1 The experimental measurement can be expressed in the form of Best Estimate Uncertainty as Random errors are statistical fluctuations (in either direction) in the measured data due to the precision limitations of the measurement device. Random errors can be evaluated through statistical analysis and can be reduced by averaging over a large number of observations. Systematic errors are reproducible inaccuracies that are consistently in the same direction. These errors are difficult to detect and cannot be analyzed statistically. If a systematic error is identified when calibrating against a standard, applying a correction or correction factor to compensate for the effect can reduce the bias. Unlike random errors, systematic errors cannot be detected or reduced by increasing the number of observations. We will make the measurement of time of fall for a free-falling small object in this part of the experiment. In the second part of the lab, we will use the time measured to determine the acceleration due to gravity. It is not too difficult to observe that a falling body falls faster and faster as it descends: it accelerates. Under certain conditions (mainly when the resistance of air is not strong) this acceleration is constant and the same for all bodies - heavy or light. The value of this acceleration due to gravity is designated as g. One of the purposes of this experiment is to determine g. Materials: Small object eg Golf ball Stop watch (you can use your phone) String and rulers to measure height Procedure: Find a location suitable for dropping your small object. Drop from a height that is high enough to minimize the relative fraction of time it takes to start and stop the stopwatch but not so high that air resistance starts to affect the result. Measure the distance the object will fall - in meters. You can use a string first and use a ruler to measure the length of the string. Time the object's fall at least 20 times. Provide the values in a table as part of your lab report. Calculate the earth's acceleration due to gravity using the relation (derived from calculus) g=2h/t where h is the height of the fall and t is the average time of fall. Use your spread in values of t to estimate your random uncertainty: At = (longest time - shortest time)/2. If there were any sources of error note them and make estimates of how much they might have affected your data Use these uncertainties to estimate the biggest and smallest possible values you could get for g: glow = 2h / (t + At ) ghi = 2h / (t - At) This gives you the range of values of g that are allowed within your uncertainty. Questions: 1. Quantitatively compare your value for g to the current best estimate for the earth's acceleration due to gravity. Consider your uncertainty when you compare. 2. How different will your time values be if you conduct the same experiment in Mars? 3. What are the possible sources of random error in your experiment? 4. What are the possible sources systemic error in your experiment? 5. How can the experiment be improved?
Step by Step Solution
There are 3 Steps involved in it

Get step-by-step solutions from verified subject matter experts