

Question: Accenture PLC Part A. Estimate return on capital (adjusted for leases) in the most recent year and weighted average cost of capital . Report whether
Accenture PLC
Part A. Estimate return on capital (adjusted for leases) in the most recent year and weighted average cost of capital . Report whether the firm creates or destroys value.
Part B. Estimate current ratio and solvency ratio in the most recent year.
Part C. Compare performance of the firm of your choice with one other firm in the same industry in the last year. Comment on your findings. Explain whether your firm outperforms the industry or underperforms it.
Note: comparable firms can be found in Google Finance or Yahoo!Finance. In Google Finance, click on related companies in the menu on the left. Yahoo! Finance will provide a longer list of comparable companies: choose competitors in the menu on the left, then, choose industry in the table direct competitor comparison. On the next page, click on sector in the middle of the page, then choose industry of your choice. You can sort companies by market capitalization and choose comparable firms. While Yahoo!Finance process is lengthier, it also provides you with a wider choice of firms.
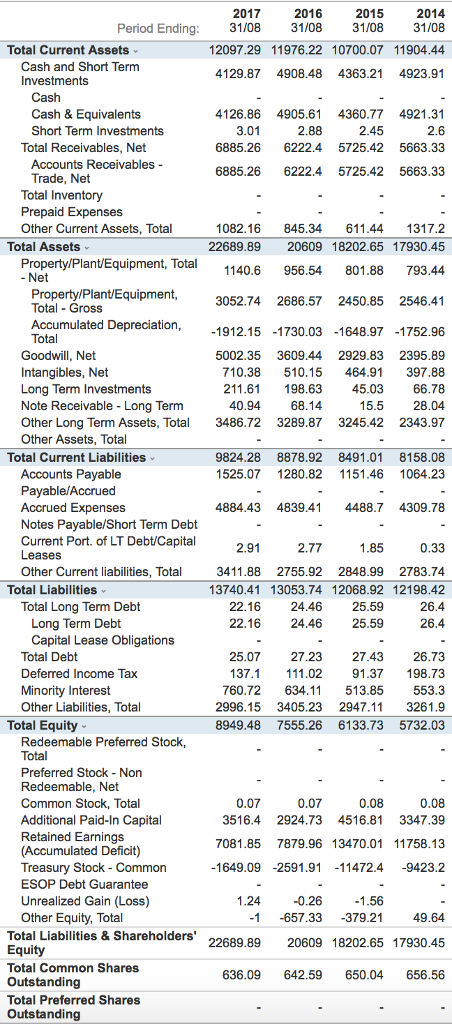
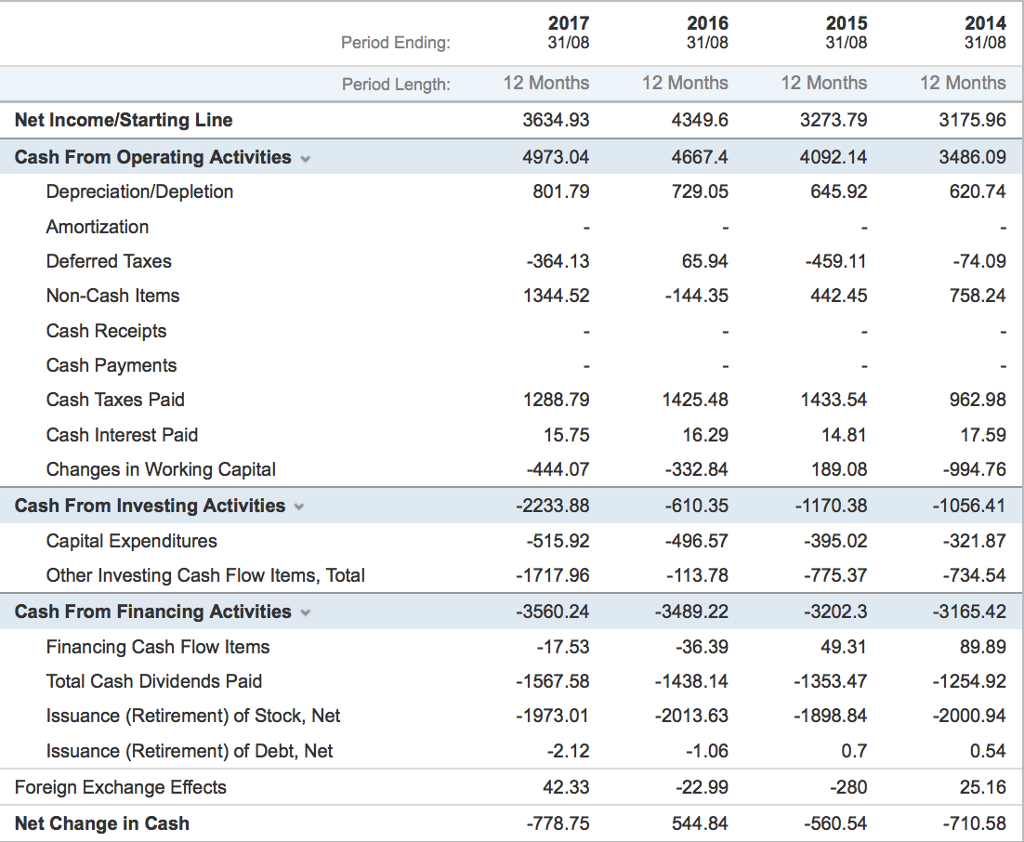
Here are income statement , balance sheet and cash flow.
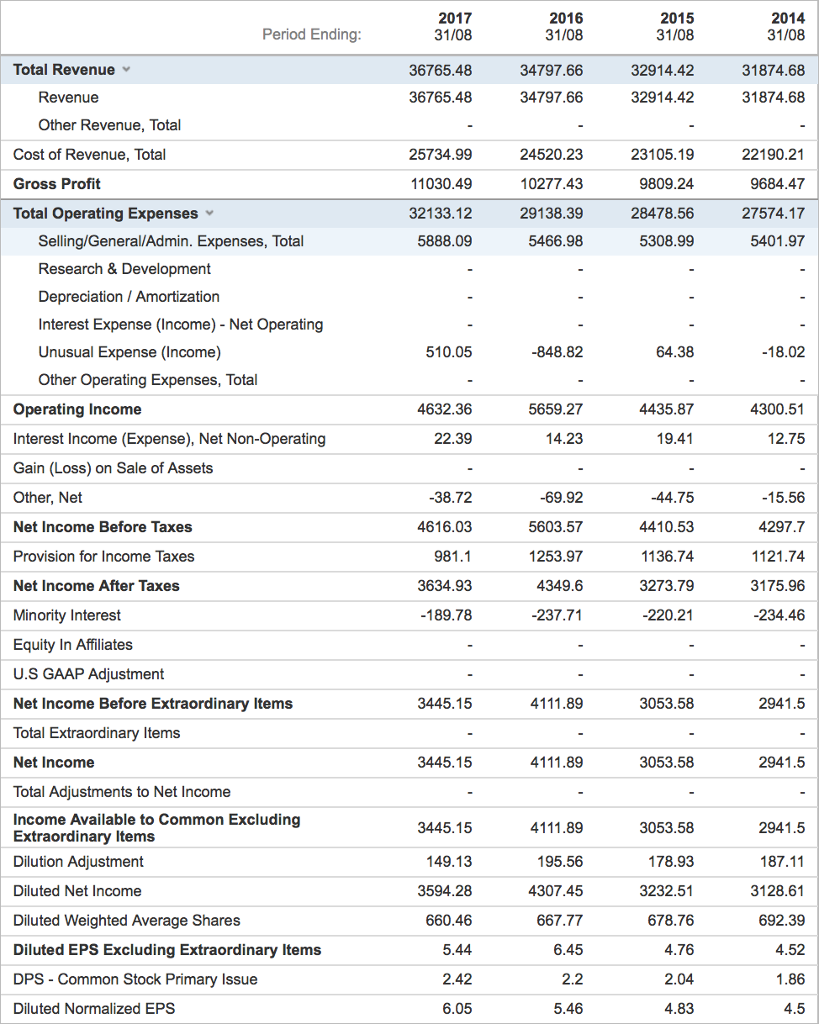
2017 2016 2015 2014 31/08 36765.48 36765.48 Period Ending 31/08 32914.42 32914.42 31/08 31874.68 31874.68 Total Revenue 34797.66 Revenue 34797.66 Other Revenue, Total Cost of Revenue, Total Gross Profit Total Operating Expenses 25734.99 11030.49 32133.12 5888.09 24520.23 10277.43 29138.39 5466.98 23105.19 9809.24 28478.56 5308.99 22190.21 9684.47 27574.17 5401.97 Selling/General/Admin. Expenses, Total Research & Development Depreciation / Amortization Interest Expense (Income) Net Operating Unusual Expense (Income) -848.82 Other Operating Expenses, Total Operating Income Interest Income (Expense), Net Non-Operating Gain (Loss) on Sale of Assets Other, Net Net Income Before Taxes Provision for Income Taxes Net Income After Taxes 4632.36 5659.27 4435.87 4300.51 12.75 4616.03 981.1 3634.93 189.78 5603.57 1253.97 4349.6 -237.71 -44.75 4410.53 1136.74 3273.79 4297.7 1121.74 3175.96 234.46 Minority Interest Equity In Affiliates U.S GAAP Adjustment Net Income Before Extraordinary Items Total Extraordinary Items Net Income Total Adjustments to Net Income 3445.15 3053.58 2941.5 3445.15 3053.58 2941.5 Income Available to Common Excluding Extraordinary Items Dilution Adjustment Diluted Net Income 3445.15 149.13 3594.28 660.46 195.56 4307.45 667.77 3053.58 178.93 3232.51 678.76 2941.5 187.11 3128.61 692.39 Diluted Weighted Average Shares Diluted EPS Excluding Extraordinary Items DPS Common Stock Primary Issue Diluted Normalized EPS
Step by Step Solution
There are 3 Steps involved in it

Get step-by-step solutions from verified subject matter experts