

Question: access Andy Field's resource page, Interact: Discover SPSS (found in the Learn section), and use the data files labeled drug.sav -or- soya.sav,invisibility_cloak.sav, and cat_reg.sav available
access Andy Field's resource page, Interact: Discover SPSS (found in the Learn section), and use the data files labeleddrug.sav-or- soya.sav,invisibility_cloak.sav,and cat_reg.savavailable there. The data files can also be found in the Research Application: Non-Parametric, T-Test, Chi-Square Resources. Your assignment uses information and data from the textbook examples which allows you to check your work, but do not simply copy and paste the wording and results. You are to demonstrate your understanding of the process related to the scenario you are using for this assignment rather than the one in the textbook.
Part A - Non-Parametric: - For this part of the assignment you will choose either: (a) Mann-Whitney (using the data files labeled drug.sav) or (b) the Kruskal-Wallis (using the data files labeled soya.sav). However, you must change the labels of the variables to something you might want to study, or something fictitious (The variables are up to you, but must be something original and something that would be measured using these analyses). You will calculate the data using the chosen non-parametric test using the data from the Field files (but with different labels).
Your paper should include the following for the analysis you choose:
- Write the research question and the null and alternative hypotheses. Remember these should be original to you, match the variables you created, and include both Ho: and Ha: (Remember to clearly label these for your reader).
- Include all of the following and briefly describe what each tells you:
- Q-Q plots
- Tests of Normality Chart
- Test of Homogeneity of Variance Chart
- Mann-Whitney U Test Summaries; Or the Independent Samples Kruskal-Wallis Test Summaries.
- Are the results statistically significant or not? How do you know?
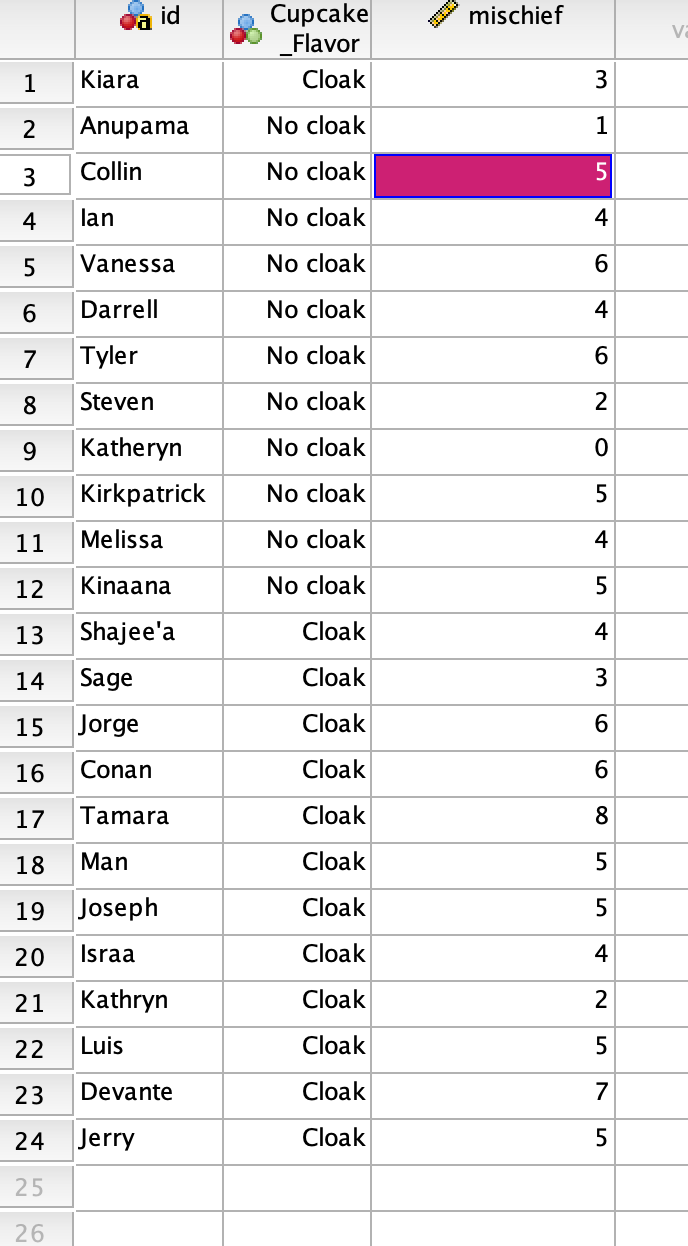
Part B - T-Test: -For this part, imagine you are a researcher interested in determining whether or not there is a difference in taste scores between white cupcakes and yellow cupcakes, both of which are flavored with the same vanilla flavoring. Some participants will eat white cupcakes, and the rest will eat yellow cupcakes. They will all be given a "taste quality" test and the scores will be compared between each group to see if there is a difference between the two types of chocolates. Perform the appropriate t-test and related analysis that would accurately measure this, and interpret the results. Use the Field data file invisibility_cloak.sav, but change the labels to fit this scenario. Use a=.05. Your outputs should include the following:
- Write the research question and the null and alternative hypotheses. Remember these should be original to you, match the variables you created, and include both Ho: and Ha: (Remember to clearly label these for your reader).
- Identify the variables in your study.
- Identify the type of T-Test appropriate to this study (independent, paired-samples, etc.).
- Include all of the following and briefly describe what each tells you:
- Q-Q plots
- Descriptives Output Chart
- Group Statistics Chart with Bootstrapping
- Samples Test
- Effect Sizes Chart
- Are the results statistically significant or not? How do you know?
Part C - Chi-Square: -For this part, imagine you are an instructor interested in wanting to know if giving different types of chocolate as a reward to psychology students in statistics classes makes a difference in whether are not they passed the chi-square exam on Friday. The instructor decided to give one class a piece of dark chocolate each time a student got the correct answer when reviewing for the exam, and the other class a piece of milk chocolate each time a student got the correct answer in that class. Instructors identify whether the students passed or did not pass the exam based on whether or not they received a score of 70 or higher.
Use the Field data file cat_reg.sav. Use the variables dance and training, but change the labels to fit this scenario. Use a=.05. Your outputs should include the following:
- Write the research question and the null and alternative hypotheses. Remember these should be original to you, match the variables you created, and include both Ho: and Ha: (Remember to clearly label these for your reader).
- Identify the variables in your study.
- Run the Chi-Square Test for Independence/Crosstabs, with both observed and expected observations. Then include all of the following, and tell what each means:
- Coefficients Table
- Crosstabulations
- A bar chart based on the Crosstabulations.
- Case Processing Summary
- Chi-Square Test Table
- What do the results tell you? How do you interpret them based on the Hypothesis(es)?
Data is here:
Step by Step Solution
There are 3 Steps involved in it

Get step-by-step solutions from verified subject matter experts