

Question: ACCG70011 Finance and Managerial Accounting Assignment #1 Chapter 14 Using the income statement, balance sheet, and extra information found below compute the following for year


ACCG70011
Finance and Managerial Accounting
Assignment #1
Chapter 14
Using the income statement, balance sheet, and extra information found below compute the following for year 2 only. Round all figures to 2 decimal points.
a. The Earnings per Share
b. The Dividend Yield Ratio
c. The Dividend Payout Ratio
d. The Price-Earnings Ratio
e. The Book Value per Common Share
f. The Gross Margin Percentage
g. The Return on Total Assets
h. The Return on Common Shareholders' Equity
i. The Working Capital
j. The Current Ratio
k. The Acid-Test Ratio
l. The Average Collection Period
m. Average Sales Period
n. The Times Interest Earned.
o. The Debt to Equity Ratio
Each ratio is worth 3 marks each, 45 marks in total.
Dividends during Year 2 totaled $45,000, of which $10,000 were preferred dividends. The remainder was common dividends. The market price of a common share on December 31, Year 2 was $30.
Make sure to show ALL work! A majority of the marks are based on the work, not the final answer. To receive full credit for each question, you must show your work, round your final answers to 2 decimal points correctly, and put the appropriate 'label' at the end of each figure (as shown below).
Assignment 1 is due June 1 11:59PM - Noon as a Microsoft Word or Excel file in the drop box located on SLATE only. Late assignments are subject to a 10% per day penalty.
Chapter 14 Labels - please note, these are not the answers, but how the answers need to be presented.
Return on Total Assets = 10.92 %
Return on Common Shareholder's Equity = 7.54%
Gross Margin Percentage = 38.63%
Earnings Per Share = $5.32 per share
Fully Diluted Earnings per Share = $5.85 per share
Price Earnings Ratio = 20 times
Dividend Payout Ratio = 20%
Dividend Yield = 20 %
Working Capital = $23 000
Current Ratio = $9 to $1
Acid Test = $2.13 to $1
Accounts Receivable Turnover = 2.57 times
Average Collection Period = 34 days
Inventory Turnover = 3.49 times
Average Sales Period = 49 days
Times Interest Earned Ratio = 3 times
Debt to Equity Ratio = $0.3 to $1
Book Value per Share = $5 per Share
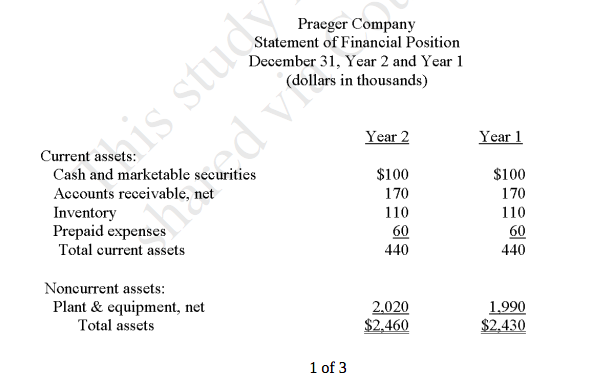
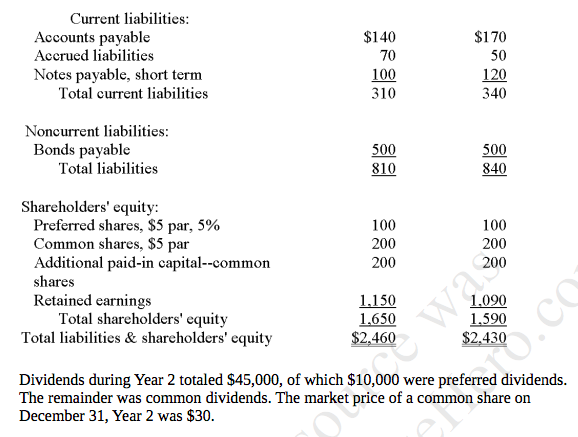
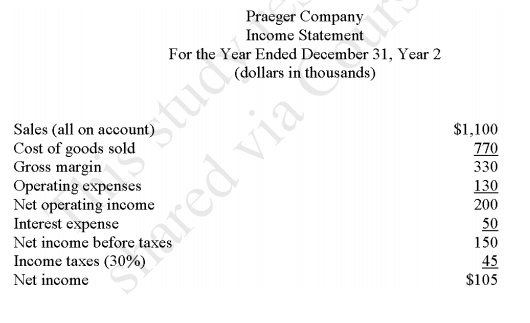
Praeger Company Statement of Financial Position December 31, Year 2 and Year 1 is stu (dollars in thousands) Year 2 Year 1 Current assets: Cash and marketable securities $100 $100 Accounts receivable, net 170 170 Inventory 110 110 Prepaid expenses 60 60 Total current assets 440 440 Noncurrent assets: Plant & equipment, net 2.020 1.990 Total assets $2.460 $2.430 1 of 3Current liabilities: Accounts payable $140 $170 Accrued liabilities 70 50 Notes payable, short term 100 120 Total current liabilities 310 340 Noncurrent liabilities: Bonds payable 500 500 Total liabilities 810 840 Shareholders' equity: Preferred shares, $5 par, 5% 100 100 Common shares, $5 par 200 200 Additional paid-in capital--common 200 200 shares Retained earnings 1.150 W 1,090 Total shareholders' equity 1.650 1.590 Total liabilities & shareholders' equity $2.460 $2.430 Dividends during Year 2 totaled $45,000, of which $10,000 were preferred dividends. The remainder was common dividends. The market price of a common share on December 31, Year 2 was $30.Praeger Company Income Statement For the Year Ended December 31, Year 2 (dollars in thousands) tu la Sales (all on account) $1,100 Cost of goods sold 770 Gross margin d v 330 Operating expenses 130 Net operating income 200 Interest expense r 50 Net income before taxes 150 Income taxes (30%) 45 Net income $105
Step by Step Solution
There are 3 Steps involved in it

Get step-by-step solutions from verified subject matter experts