

Question: According the table given below and answer the following questions Table 1. Brownie output for different numbers of workers. One oven. Workers output( brownies) 30.0
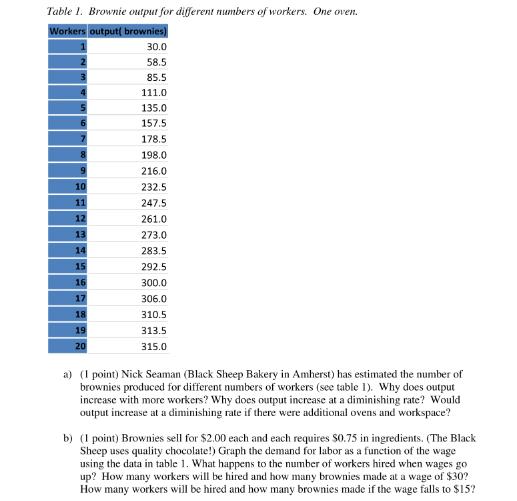
Table 1. Brownie output for different numbers of workers. One oven. Workers output( brownies) 30.0 58.5 85.5 111.0 135.0 157.5 178.5 198.0 216.0 232.5 247.5 261.0 273.0 283.5 292.5 300.0 306.0 310.5 313.5 315.0 10 11 12 13 14 15 16 17 18 19 20 a) (I point) Nick Seaman (Black Sheep Bakery in Amherst) has estimated the number of brownies produced for different numbers of workers (see table 1). Why does output increase with more workers? Why does output increase at a diminishing rate? Would output increase at a diminishing rate if there were additional ovens and workspace? b) (I point) Brownies sell for $2.00 each and each requires $0.75 in ingredients. (The Black Sheep uses quality chocolate!) Graph the demand for labor as a function of the wage using the data in table 1. What happens to the number of workers hired when wages go up? How many workers will be hired and how many brownies made at a wage of $30? How many workers will be hired and how many brownies made if the wage falls to $15?
Step by Step Solution
There are 3 Steps involved in it
a Output increases with more workers because each additional worker contributes to the production of brownies However output increases at a diminishin... View full answer

Get step-by-step solutions from verified subject matter experts