

Question: According to Techsoft's current situation, what is this company's Current Supply Chain Process Map? What is your recommendation for this workflow to improve? 12 X
According to Techsoft's current situation, what is this company's Current Supply Chain Process Map? What is your recommendation for this workflow to improve?
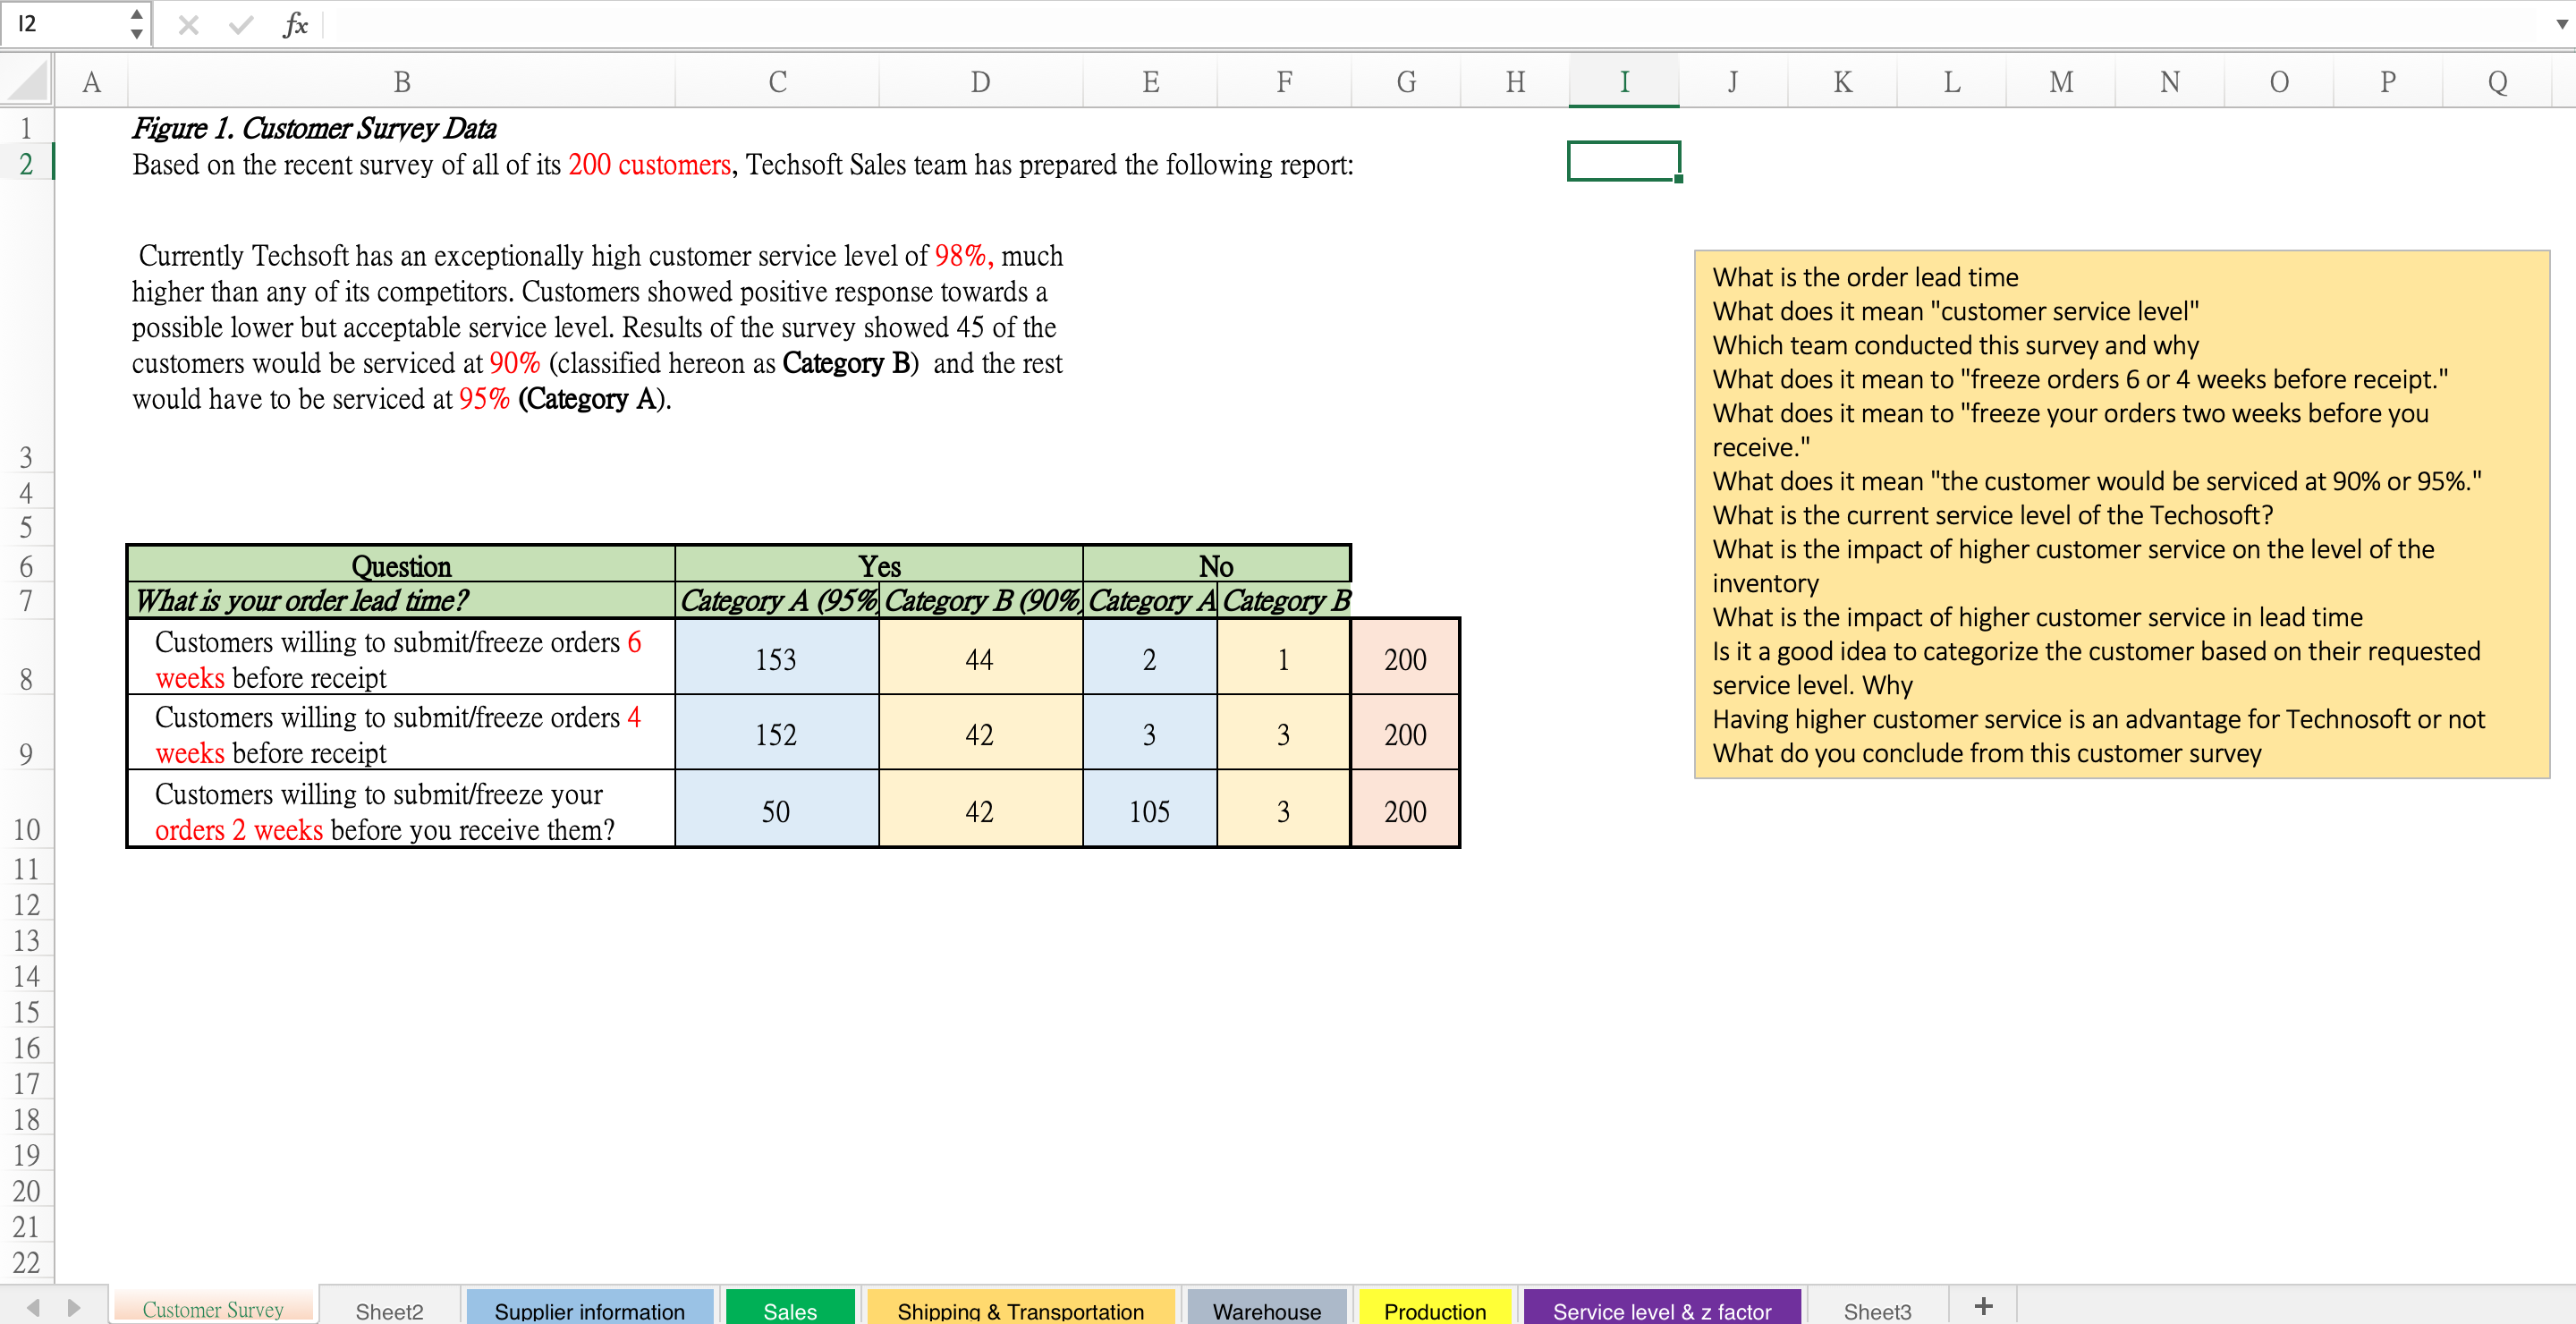
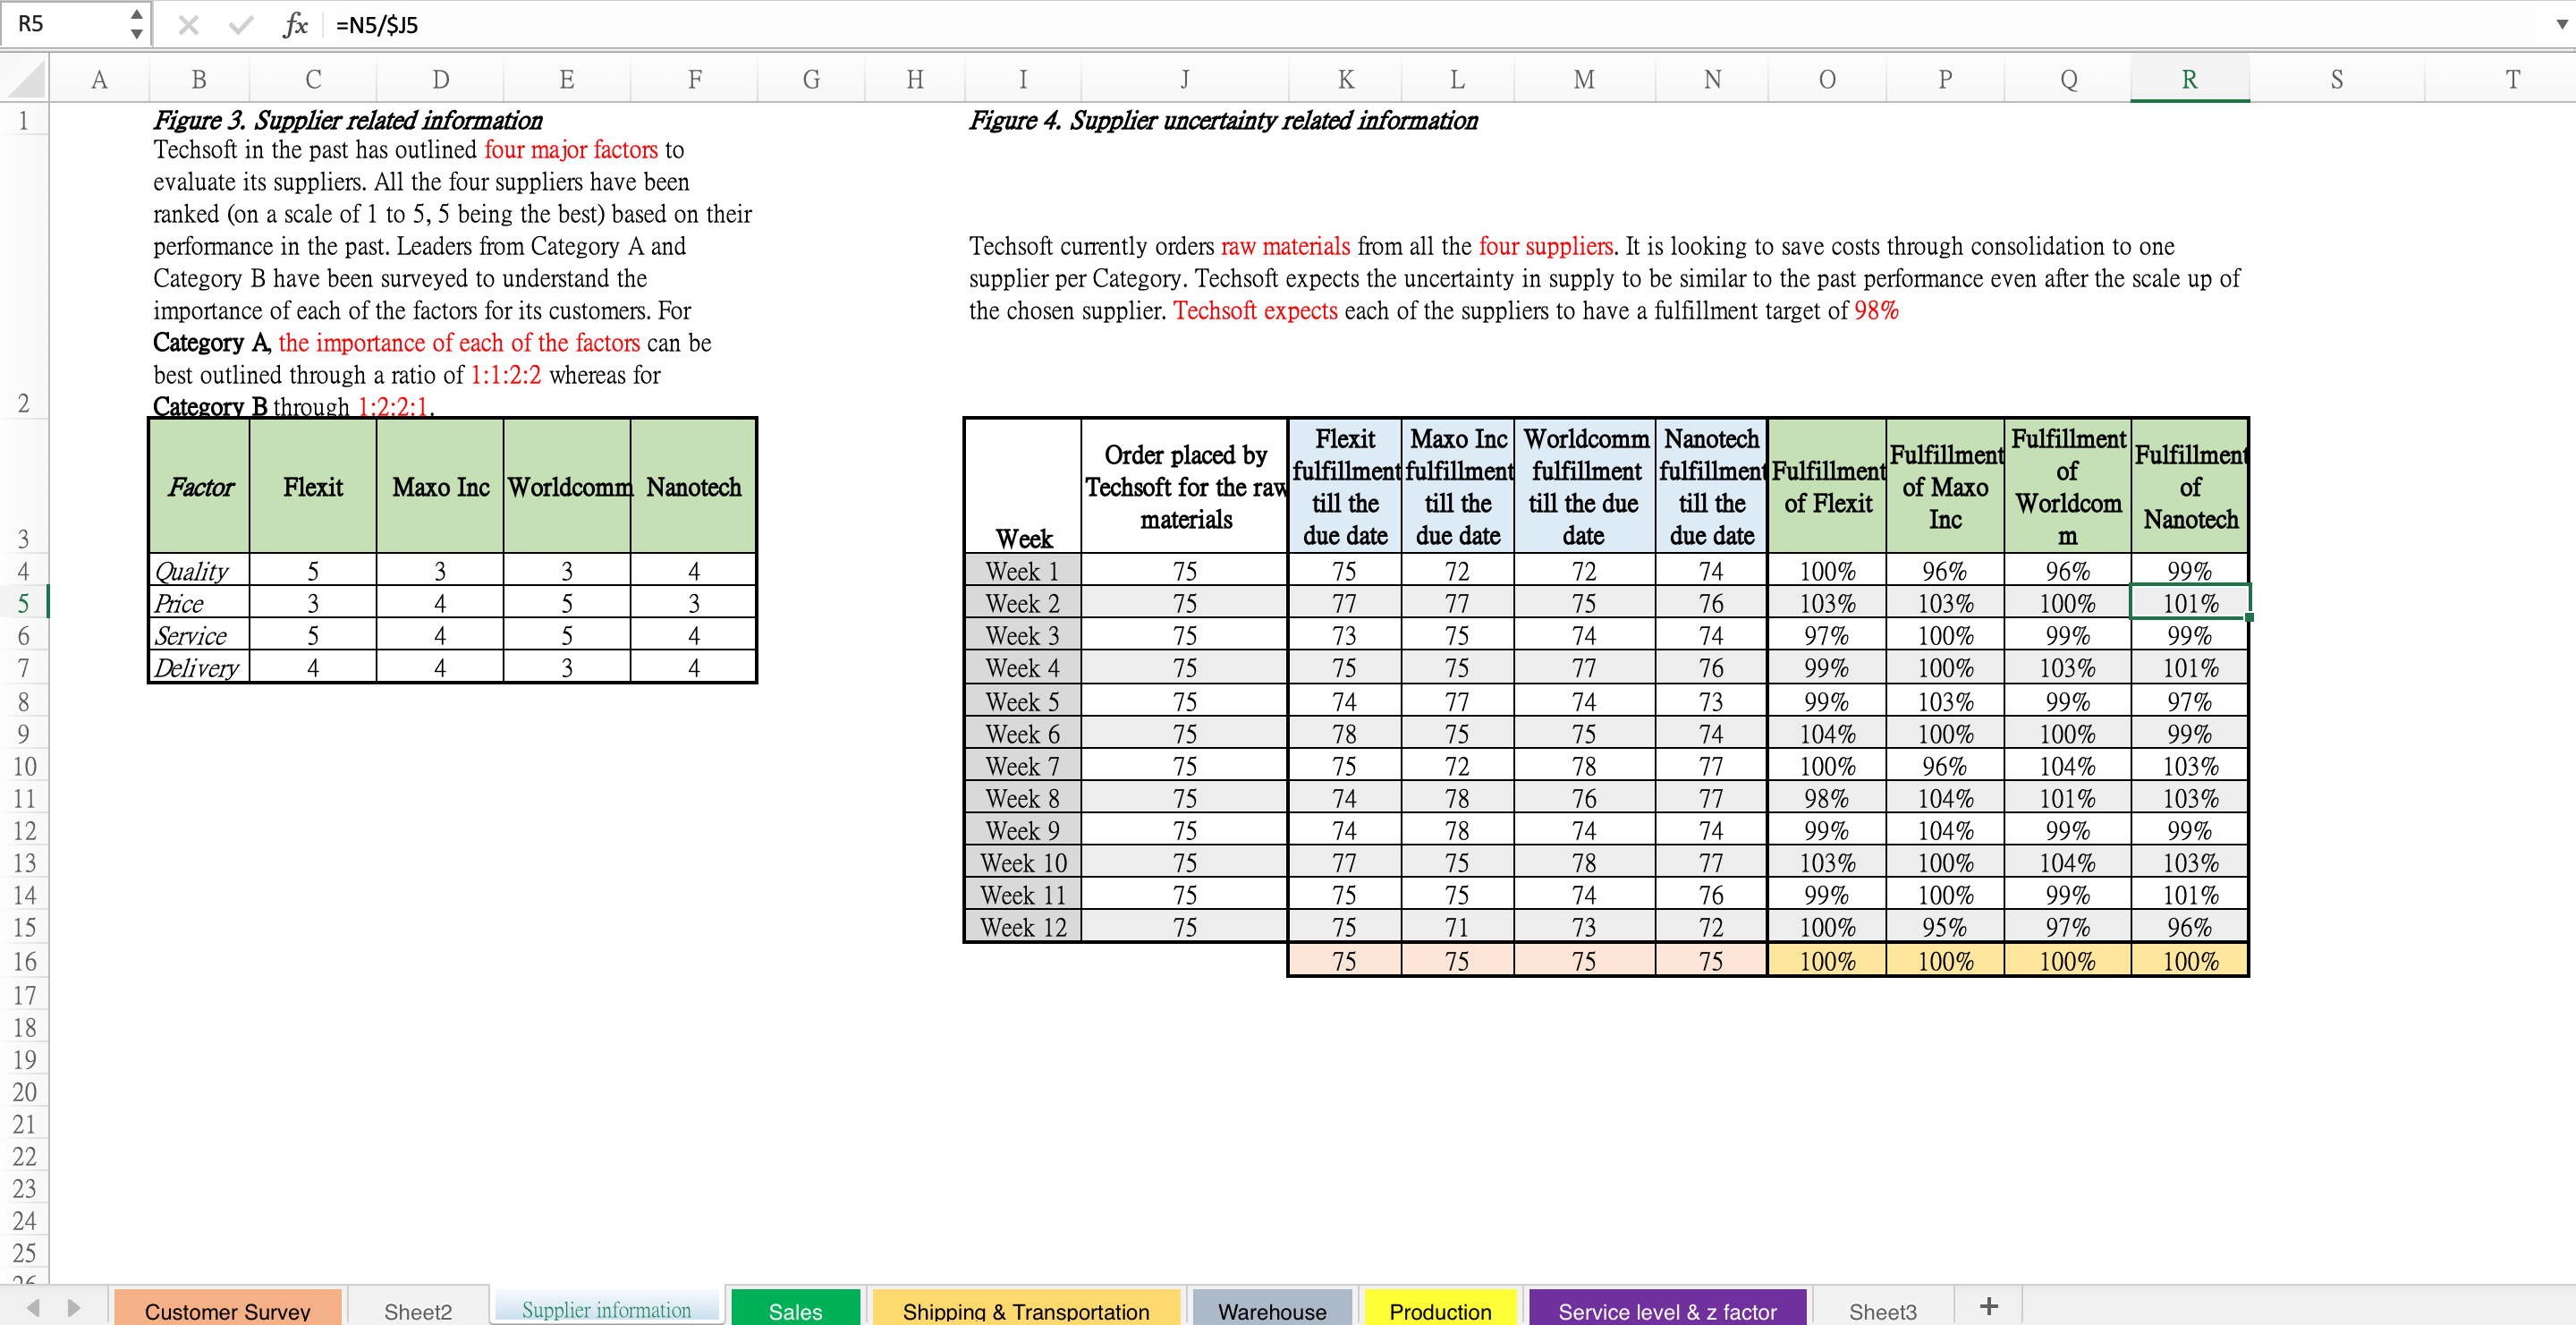
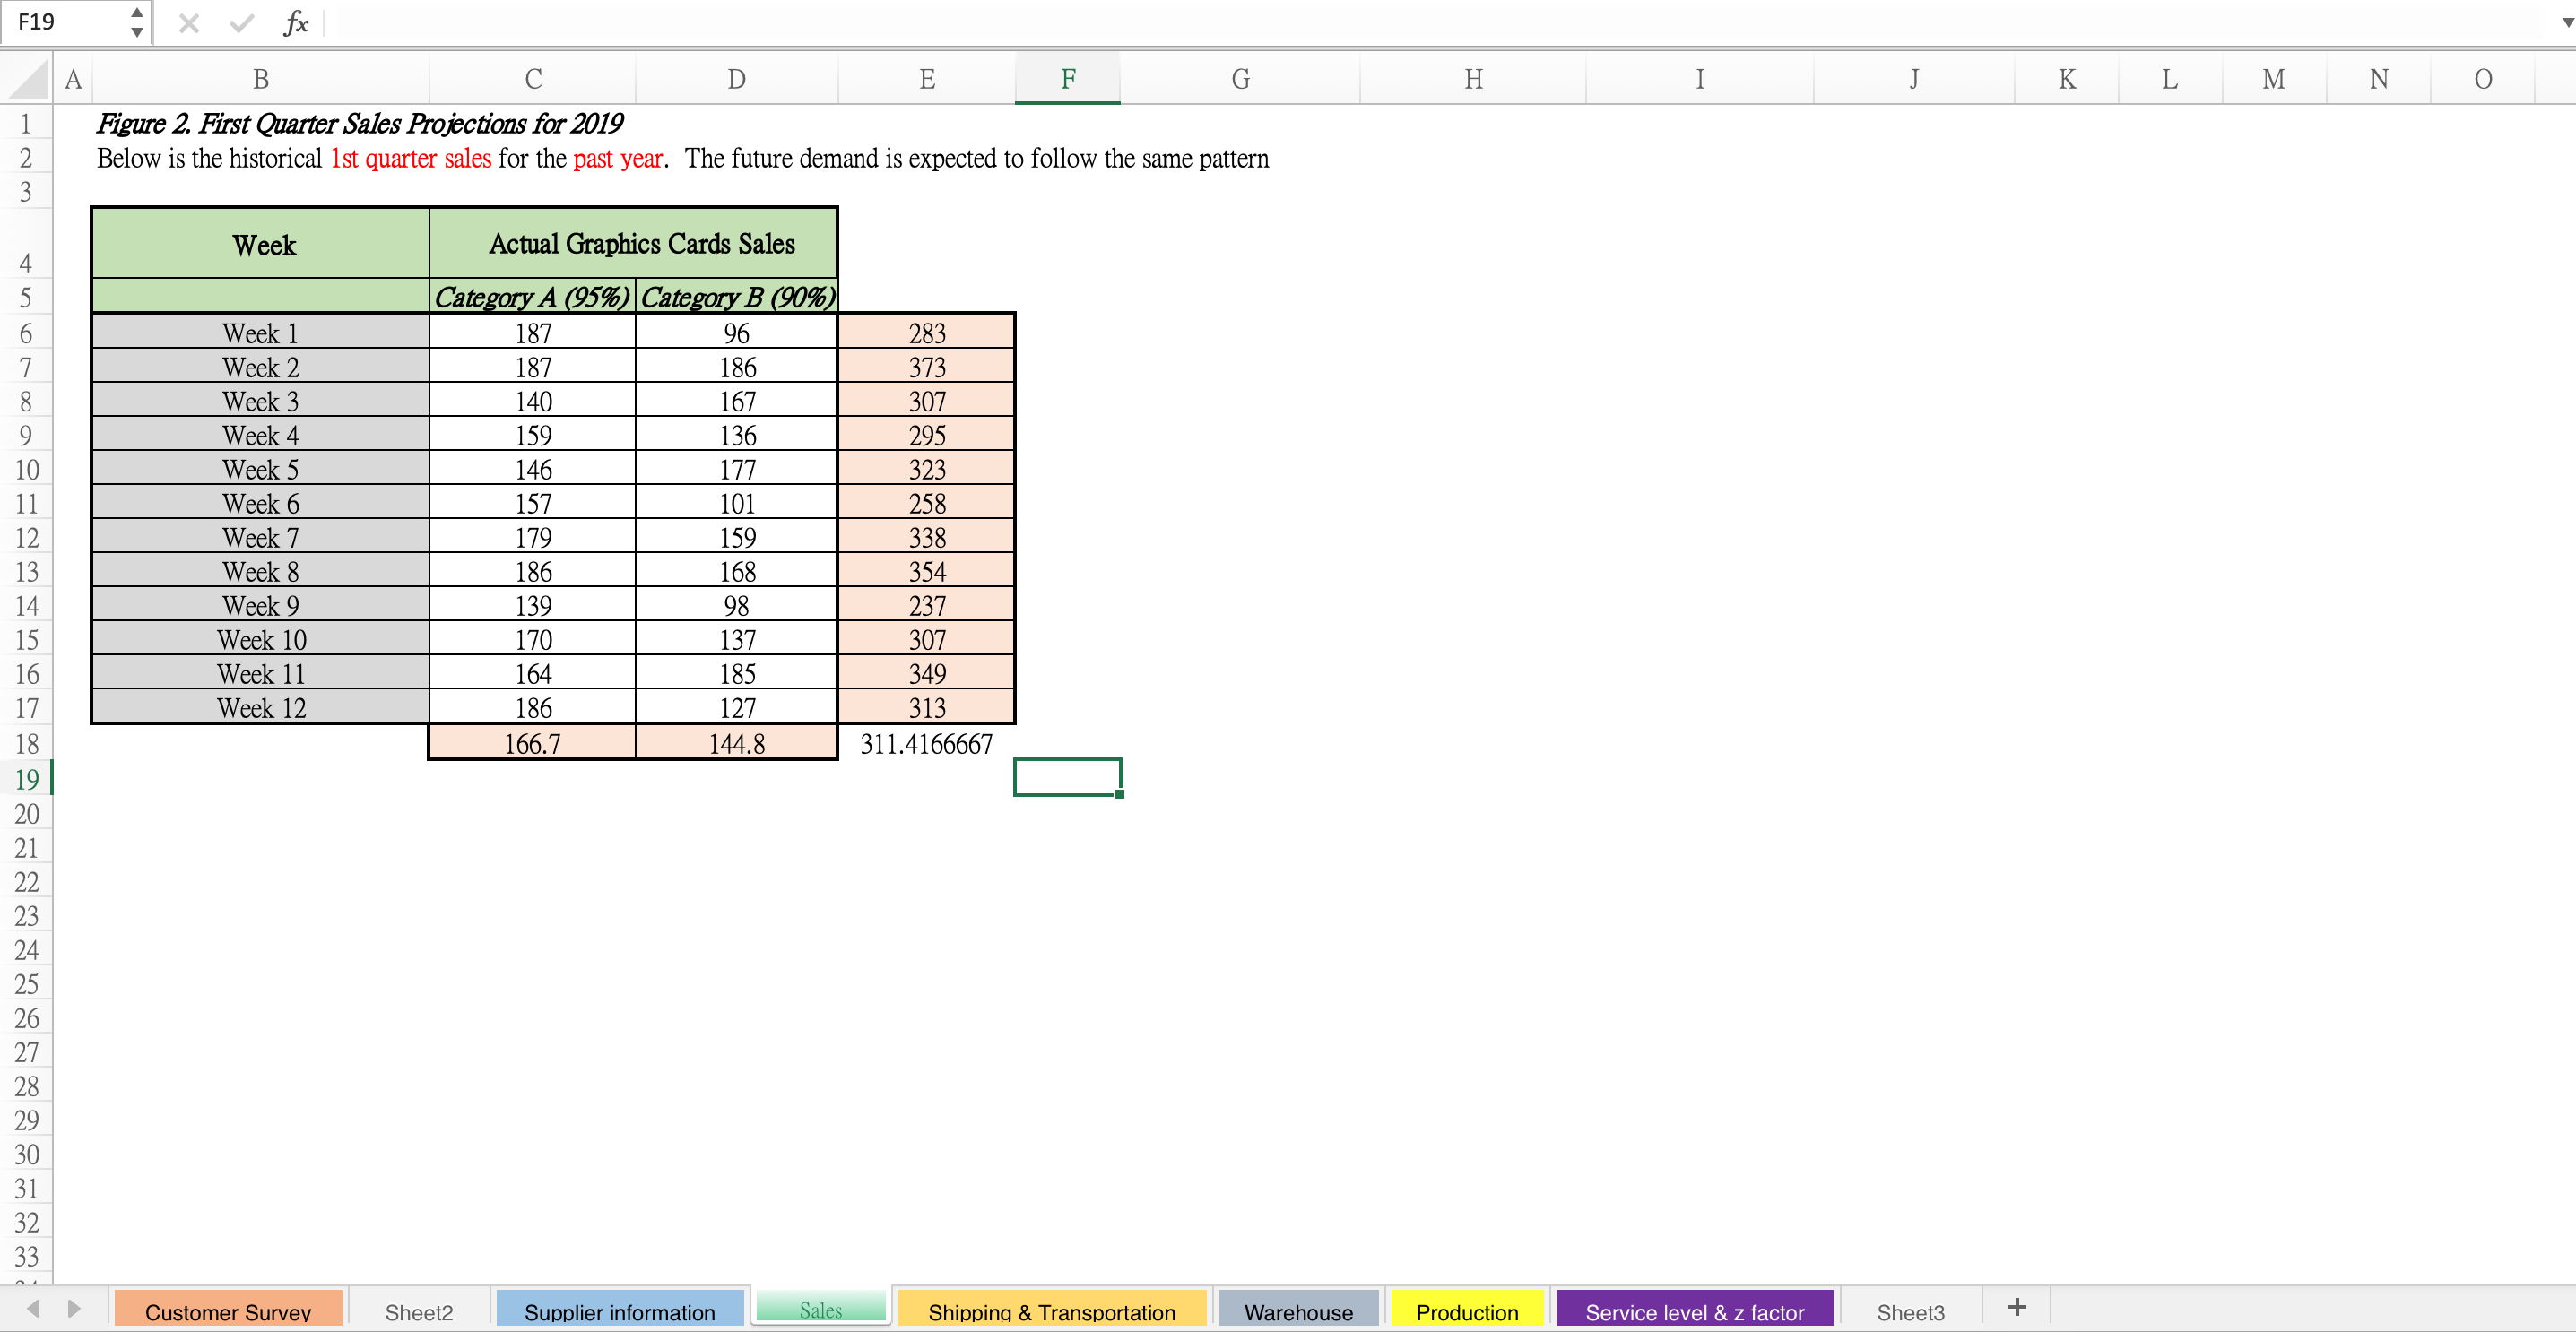
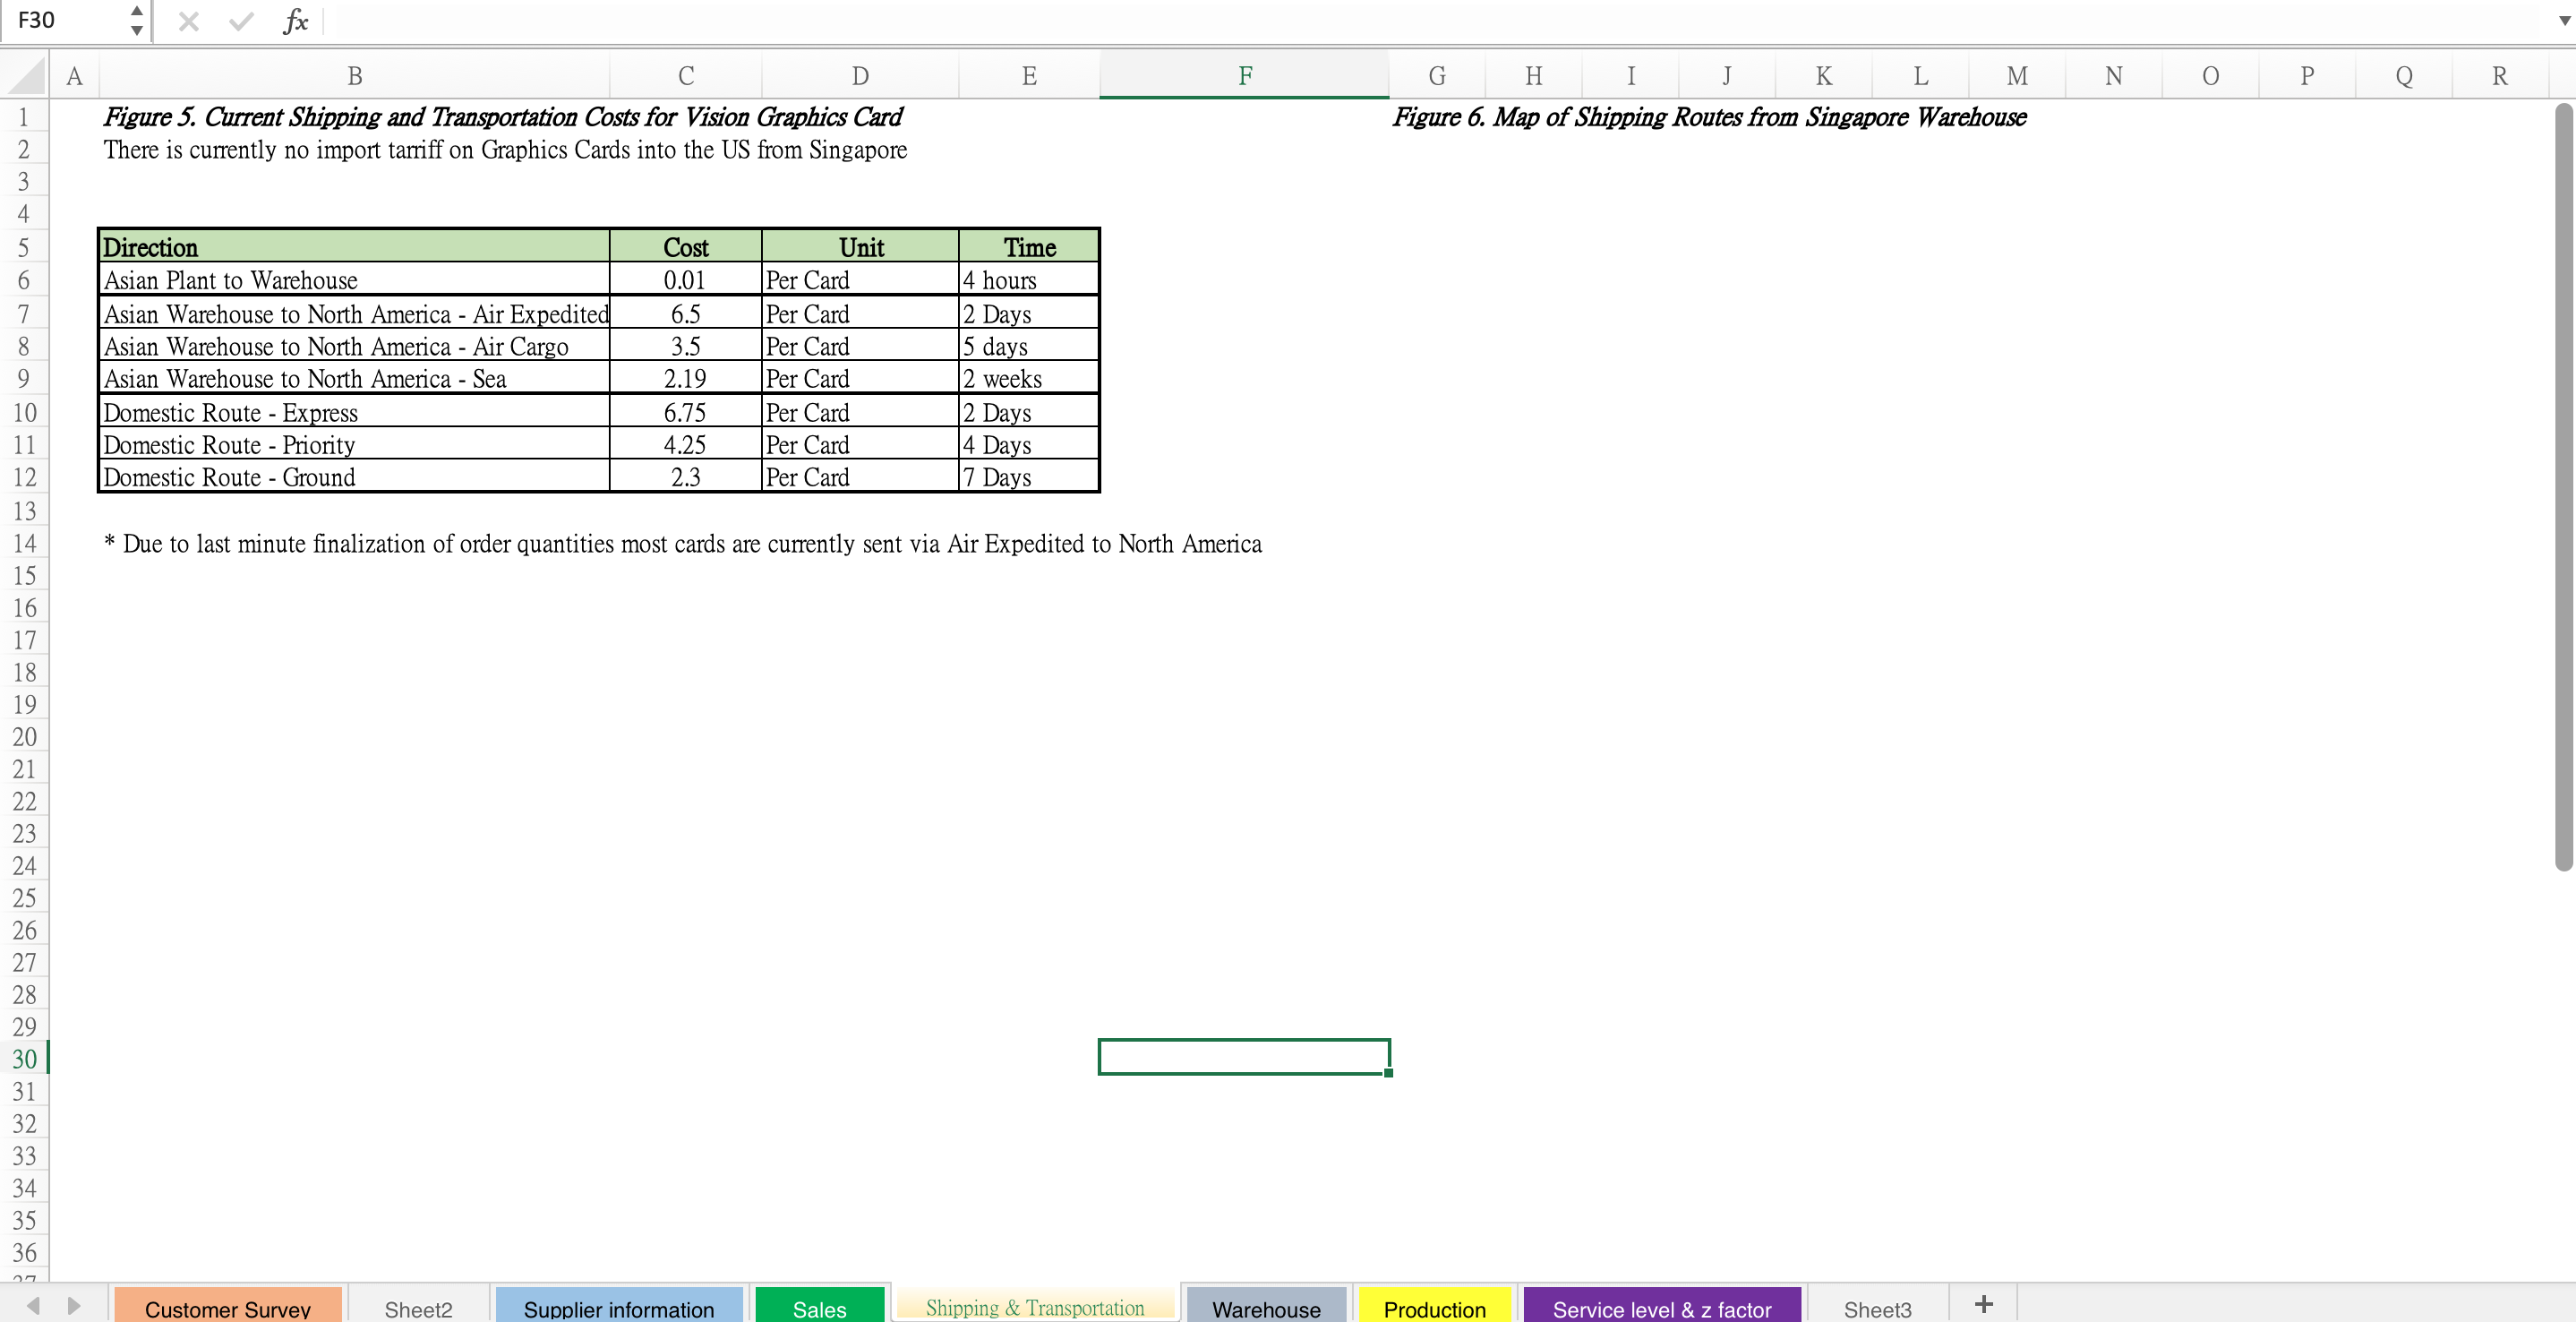
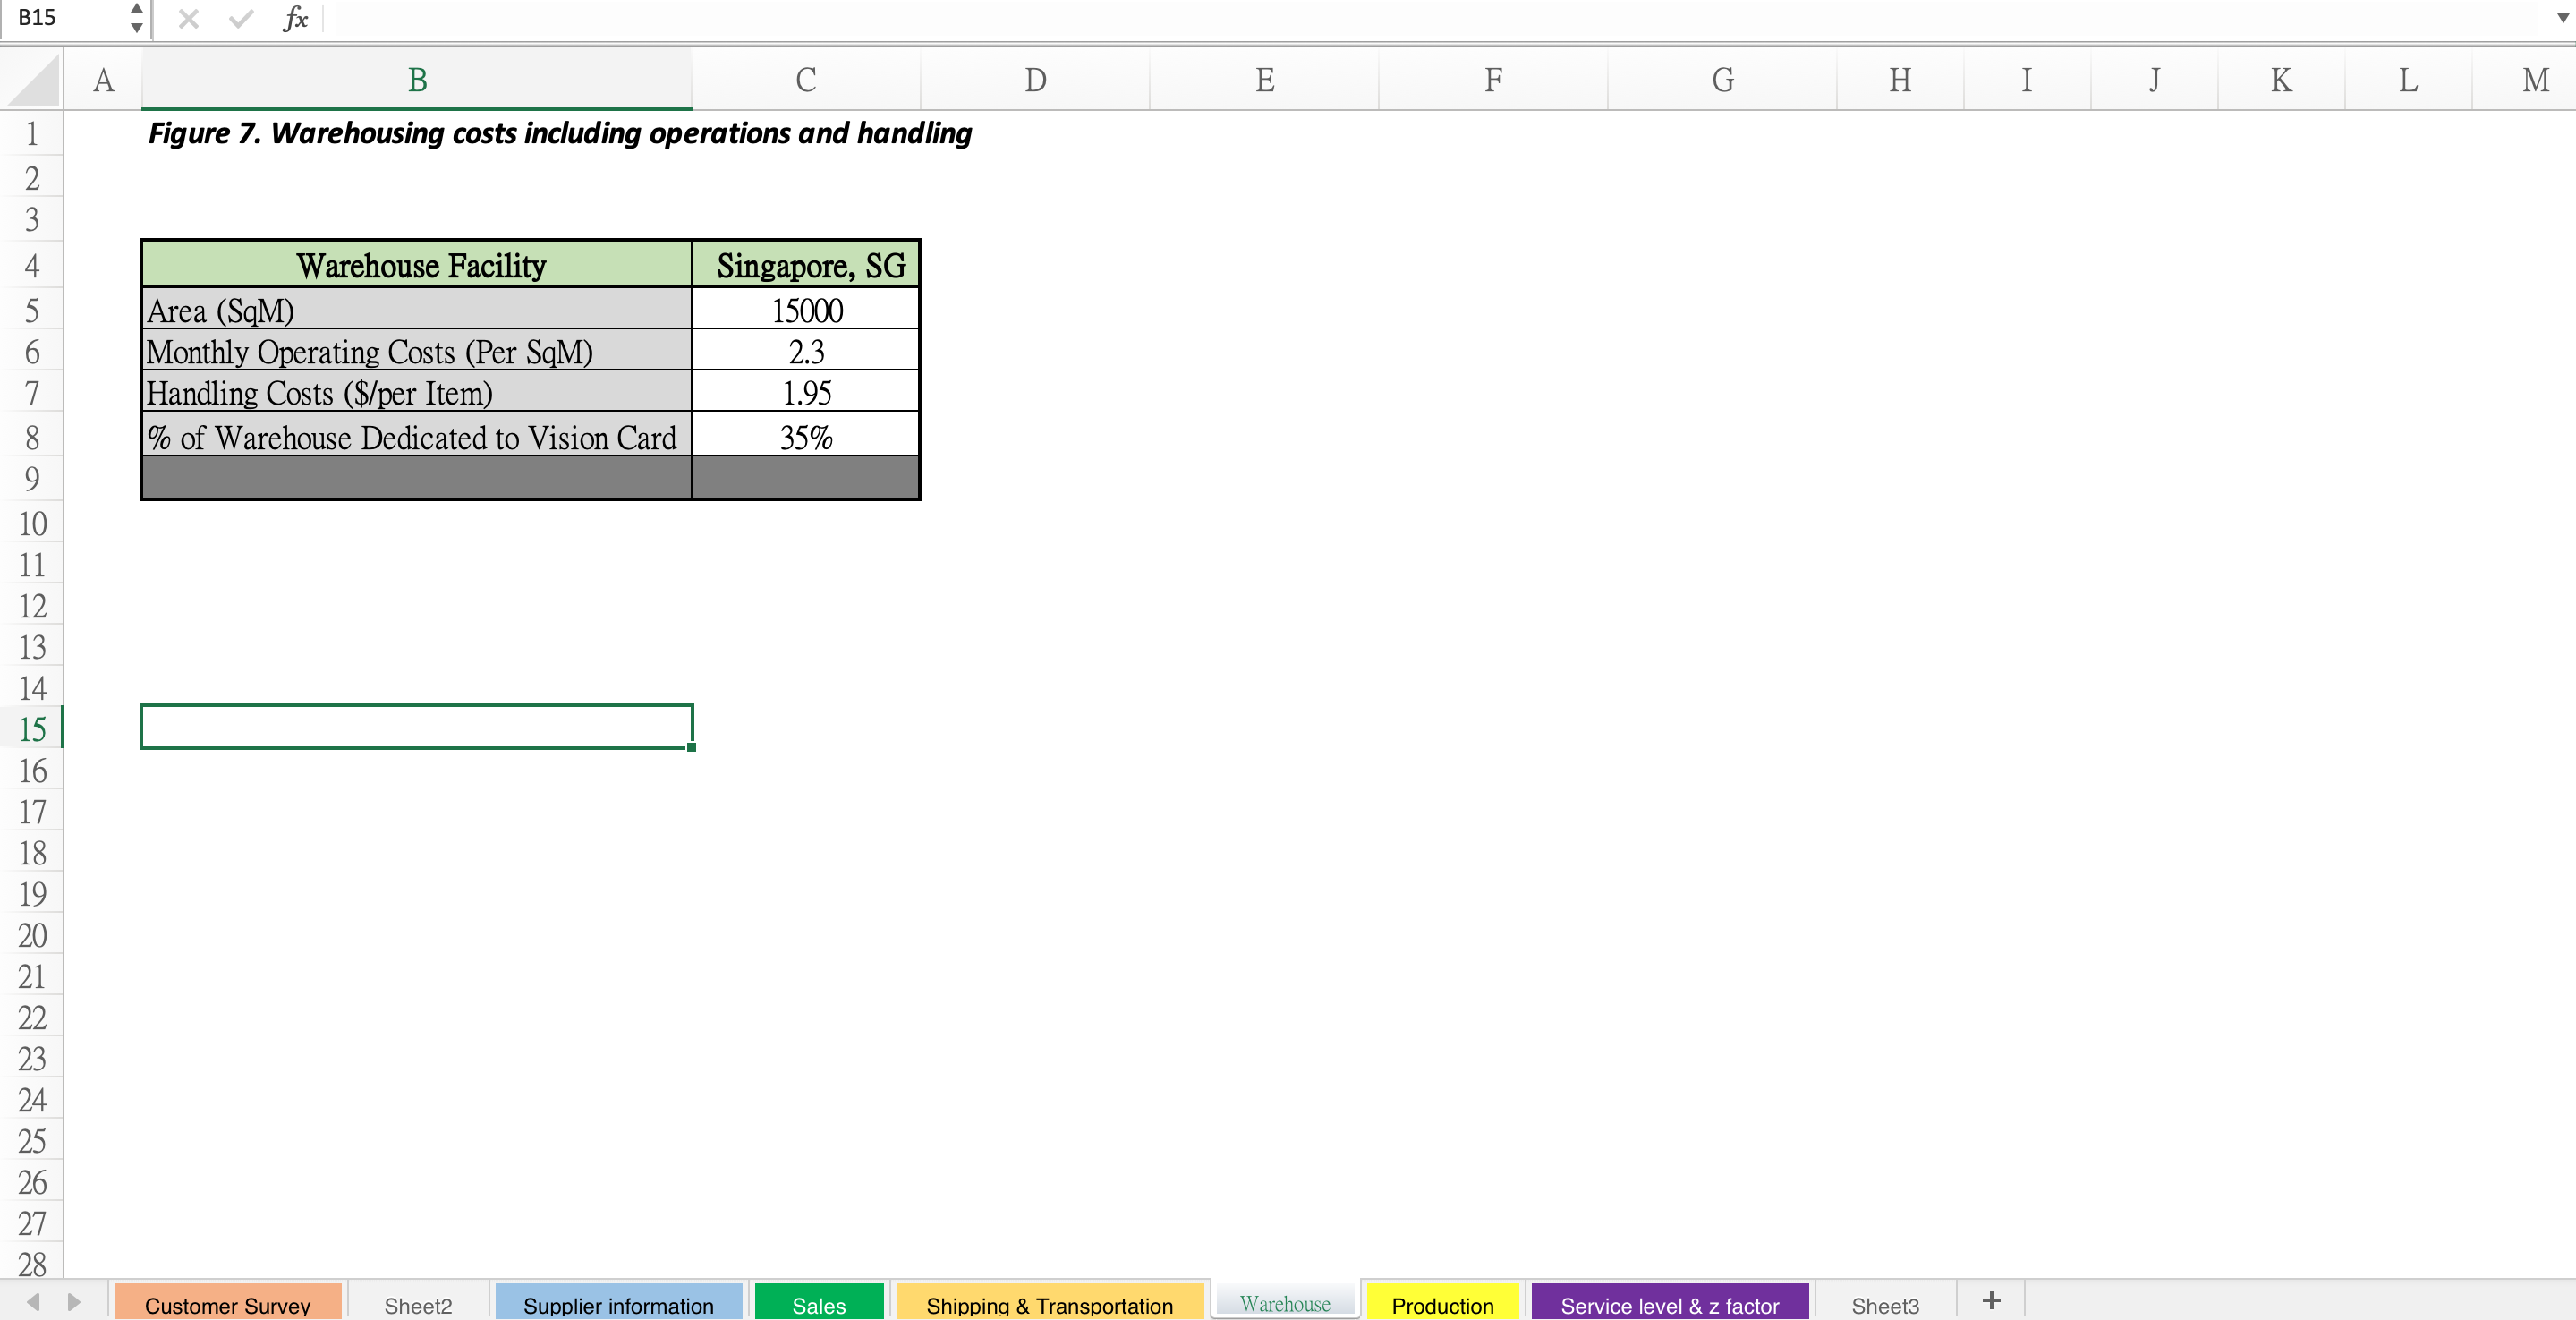
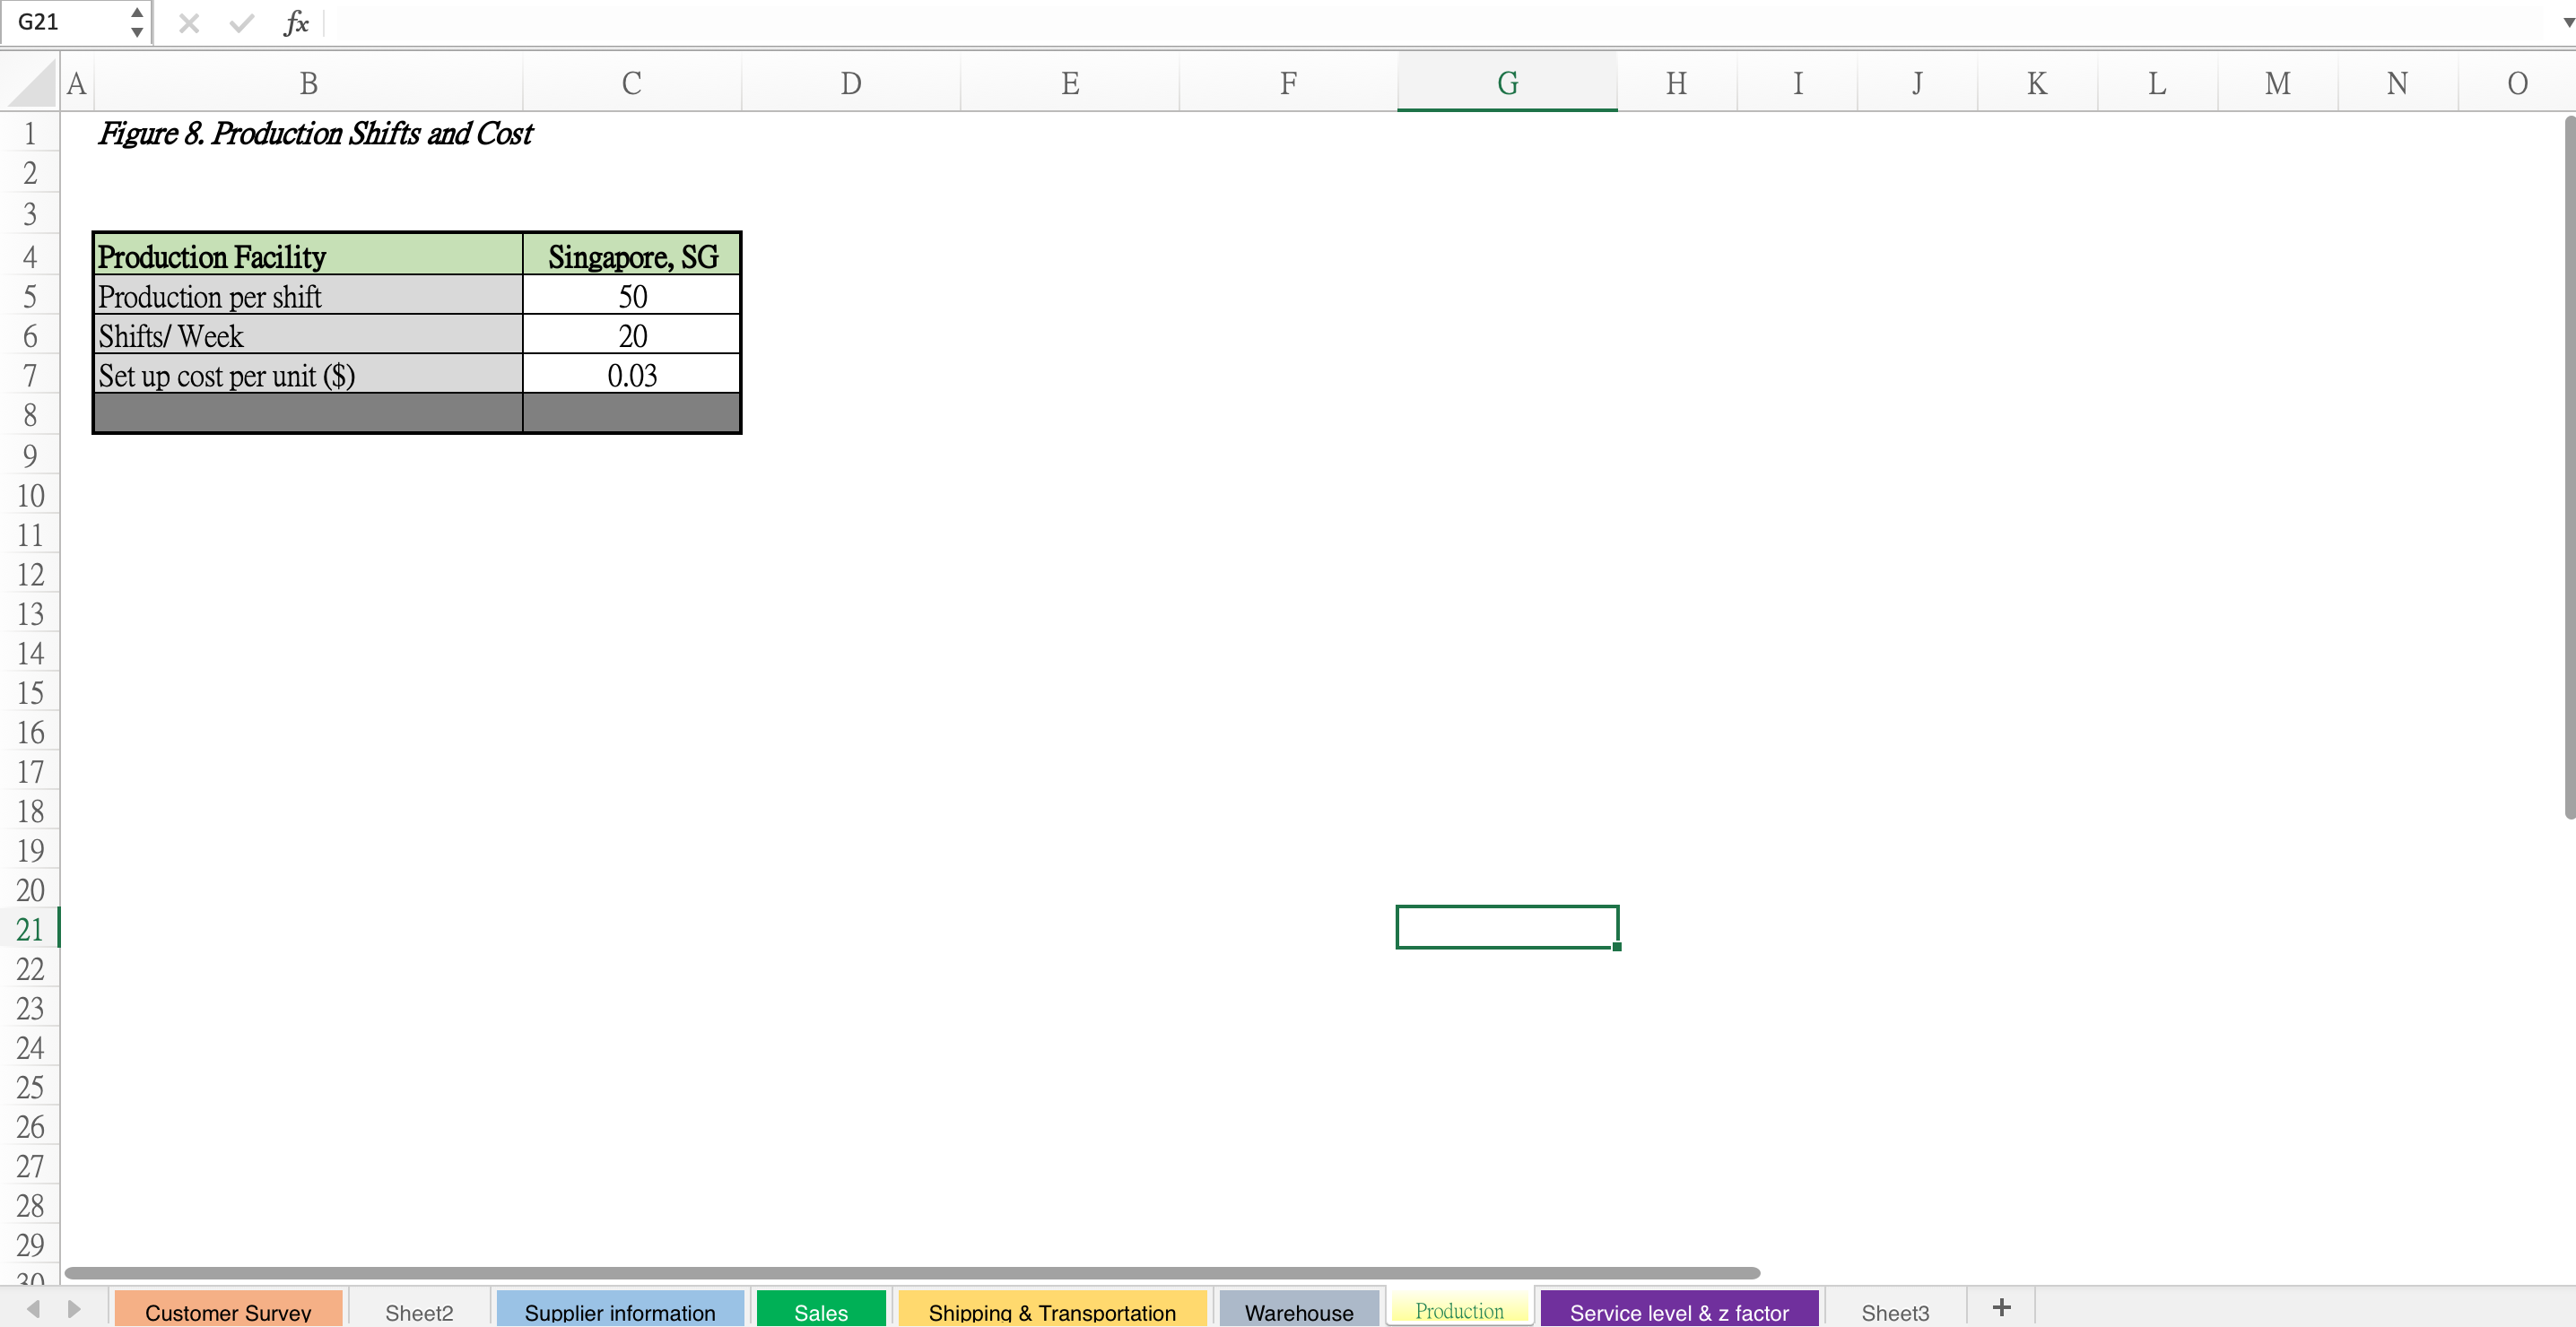
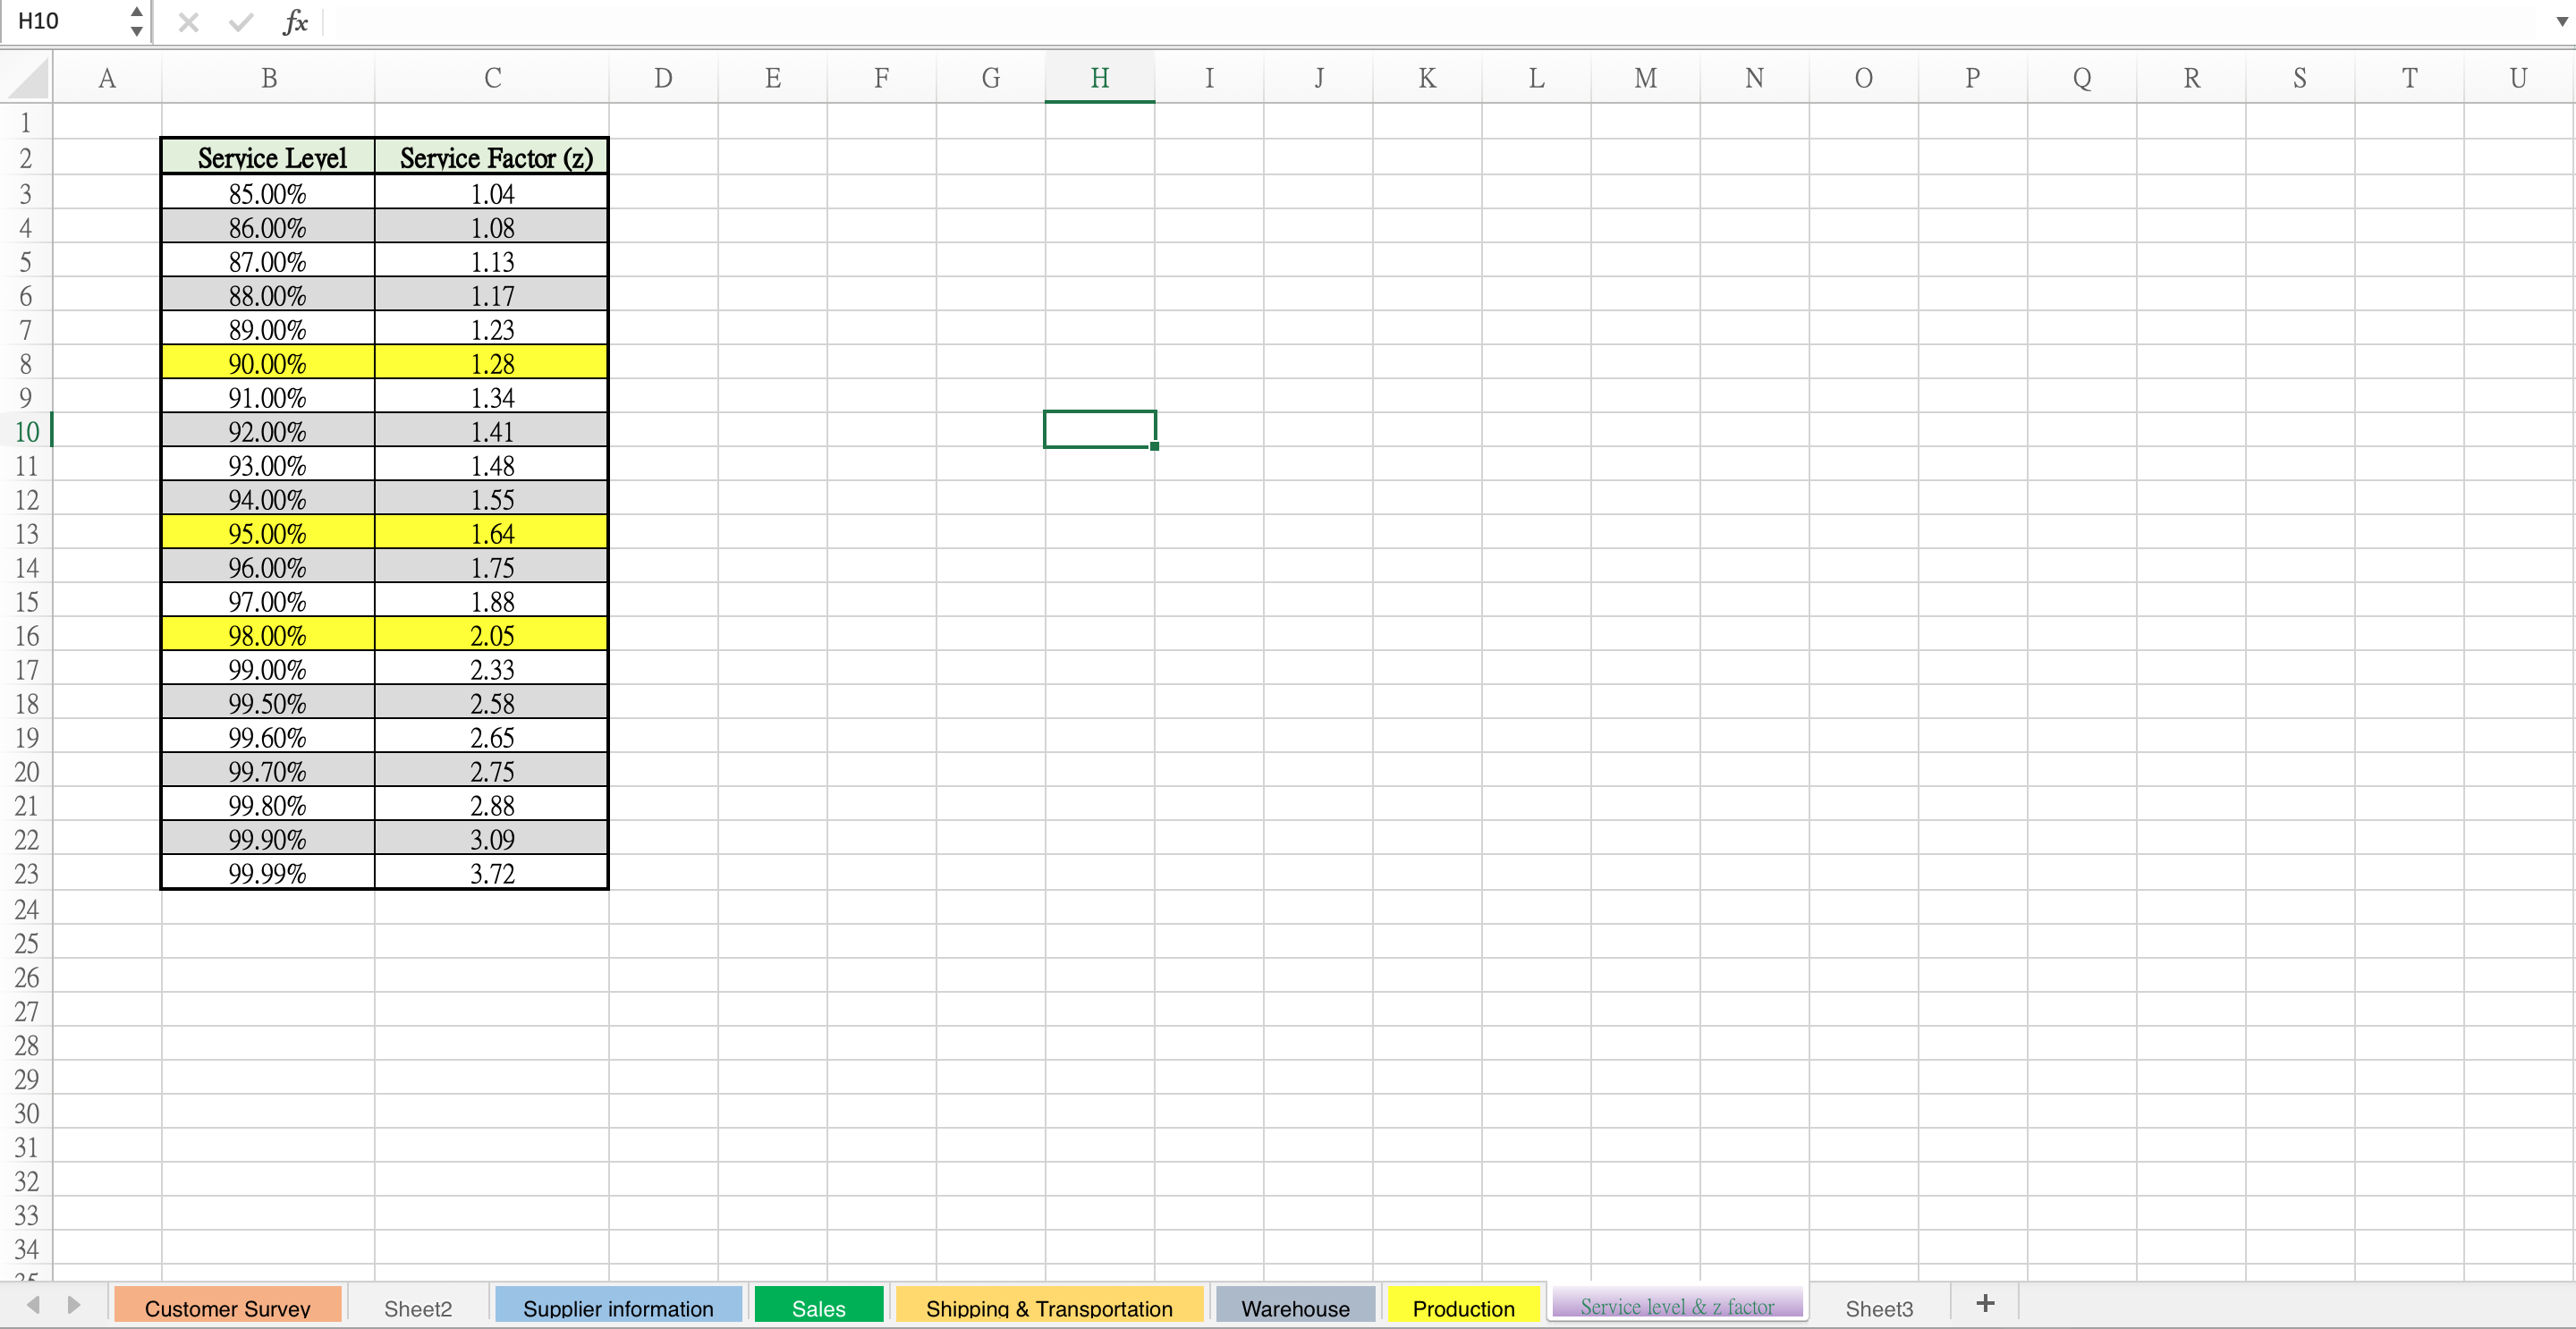
12 X V fx A B C D E F G H I J K L M N O P Q Figure 1. Customer Survey Data NO Based on the recent survey of all of its 200 customers, Techsoft Sales team has prepared the following report: Currently Techsoft has an exceptionally high customer service level of 98%, much higher than any of its competitors. Customers showed positive response towards a What is the order lead time possible lower but acceptable service level. Results of the survey showed 45 of the What does it mean "customer service level" customers would be serviced at 90% (classified hereon as Category B) and the rest Which team conducted this survey and why would have to be serviced at 95% (Category A). What does it mean to "freeze orders 6 or 4 weeks before receipt." What does it mean to "freeze your orders two weeks before you receive." What does it mean "the customer would be serviced at 90% or 95%." U. A W What is the current service level of the Techosoft? Question Yes No What is the impact of higher customer service on the level of the What is your order lead time? Category A (95% Category B (90% Category A Category B inventory What is the impact of higher customer service in lead time Customers willing to submit/freeze orders 6 153 44 2 200 Is it a good idea to categorize the customer based on their requested weeks before receipt service level. Why Customers willing to submit/freeze orders 4 152 42 3 3 200 Having higher customer service is an advantage for Technosoft or not 9 weeks before receipt What do you conclude from this customer survey Customers willing to submit/freeze your 50 42 105 3 orders 2 weeks before you receive them? 200 10 11 12 13 14 16 17 18 19 20 21 22 Customer Survey Sheet2 Supplier information Sales Shipping & Transportation Warehouse Production Service level & z factor Sheet3 +R5 X V fx =N5/$15 A B D E F G H I K L M N O P Q R S T Figure 3. Supplier related information Figure 4. Supplier uncertainty related information Techsoft in the past has outlined four major factors to evaluate its suppliers. All the four suppliers have been ranked (on a scale of 1 to 5, 5 being the best) based on their performance in the past. Leaders from Category A and Techsoft currently orders raw materials from all the four suppliers. It is looking to save costs through consolidation to one Category B have been surveyed to understand the supplier per Category. Techsoft expects the uncertainty in supply to be similar to the past performance even after the scale up of importance of each of the factors for its customers. For the chosen supplier. Techsoft expects each of the suppliers to have a fulfillment target of 98% Category A, the importance of each of the factors can be best outlined through a ratio of 1:1:2:2 whereas for Category B through 1:2:2:1 Order placed by Flexit Maxo Inc Worldcomm Nanotech Fulfillment fulfillment fulfillment fulfillment fulfillment Fulfillment Fulfillmen Fulfillment Factor Flexit Maxo Inc Worldcomm Nanotech Techsoft for the raw of of till the till the till the due till the of Flexit of Maxo materials Inc Worldcom date due date Nanotech w Week due date due date m Quality 5 Week 1 75 7: 72 72 74 100% 96% 96% 19% Price 3 Week 2 75 77 77 75 76 103% 103% 100% 01% Service 5 Week 3 75 73 75 74 74 7% 100% 19% Delivery 4 Week 4 75 75 75 77 76 99% 100% 103% 01% Week 5 75 74 77 74 73 103% 9% 7% Week 6 75 78 75 75 74 104% 100% 100% 29% 10 Week 7 75 75 72 78 77 100% 96% 1040 103% Week 8 75 74 78 76 77 98% 104% 101% 03% Week 9 75 74 78 74 74 29% 04% 29% Week 10 75 77 75 78 77 103% 100% 104% 103% 14 Week 11 75 75 75 74 76 100% 19% 01% Week 12 75 75 71 73 72 100% 5 7% 96% 75 75 75 75 100% 100% 100% 100% 19 20 21 22 23 24 25 Customer Survey Sheet2 Supplier information Sales Shipping & Transportation Warehouse Production Service level & z factor Sheet3 +F19 + X V fx A B C D E F G H I J K L M N O Figure 2. First Quarter Sales Projections for 2019 N Below is the historical Ist quarter sales for the past year. The future demand is expected to follow the same pattern Week Actual Graphics Cards Sales Category A (95%) Category B (90%) Week 1 187 96 283 Week 2 187 186 373 Week 3 140 167 307 Week 4 159 136 295 Week 5 146 177 323 Week 6 157 101 258 12 Week 7 179 159 338 13 Week 8 186 168 354 14 Week 9 139 28 237 15 Week 10 170 137 307 16 Week 11 164 185 349 17 Week 12 186 27 313 18 166.7 144.8 311.4166667 19 20 22 23 24 25 26 27 28 29 30 31 32 33 D Customer Survey Sheet2 Supplier information Sales Shipping & Transportation Warehouse Production Service level & z factor Sheet3 +F30 + X V fx A B C D E F G H I J K L M N O P Q R Figure 5. Current Shipping and Transportation Costs for Vision Graphics Card Figure 6. Map of Shipping Routes from Singapore Warehouse N There is currently no import tarriff on Graphics Cards into the US from Singapore Direction Cost Unit Time Asian Plant to Warehouse 0.01 Per Card 4 hours Asian Warehouse to North America - Air Expedited 6.5 Per Card 2 Days Asian Warehouse to North America - Air Cargo 3.5 Per Card 5 days Asian Warehouse to North America - Sea 2.19 Per Card 2 weeks 10 Domestic Route - Express 5.75 Per Card 2 Days 11 Domestic Route - Priority 4.25 Per Card 4 Days 12 Domestic Route - Ground 2.3 Per Card 7 Days 13 14 * Due to last minute finalization of order quantities most cards are currently sent via Air Expedited to North America 15 16 17 18 19 20 21 22 23 24 25 26 27 28 29 30 31 32 33 34 35 36 Customer Survey Sheet2 Supplier information Sales Shipping & Transportation Warehouse Production Service level & z factor Sheet3 +B15 X V fx A B C D E F G H I J K L M Figure 7. Warehousing costs including operations and handling W N H Warehouse Facility Singapore, SG Area (SqM) 15000 Monthly Operating Costs (Per SqM) 2.3 Handling Costs ($/per Item) 1.95 % of Warehouse Dedicated to Vision Card 35% Customer Survey Sheet2 Supplier information Sales Shipping & Transportation Warehouse Production Service level & z factor Sheet3 +G21 + X V fx A B C D E F G H I J K L M N O Figure 8. Production Shifts and Cost WNH Production Facility Singapore, SG Production per shift 50 Shifts/ Week 20 Set up cost per unit ($) 0.03 28 29 20 4 Customer Survey Sheet2 Supplier information Sales Shipping & Transportation Warehouse Production Service level & z factor Sheet3 +H10 + X V fx A B C D E F G H I J K L M N P Q R S T U N Service Level Service Factor (z) 85.00% .04 86.00% 1.08 37.00% 1.13 88.00% 1.17 89.00% 1.23 90.00 1.28 91.00% 1.34 92.00% 1.41 93.00% 1.48 94.00% 1.55 95.00% 1.6 GAWN 96.00% 1.75 97.00% .88 16 98.00% 2.05 17 99.00% 2.33 18 99.50% 2.58 19 99.60% 2.65 20 99.70% 2.75 21 99.80% 2.88 22 99.90% 3.09 23 99.99% 3.72 24 25 26 27 28 29 30 31 32 33 34 4 D Customer Survey Sheet2 Supplier information Sales Shipping & Transportation Warehouse Production Service level & z factor Sheet3 +
Step by Step Solution
There are 3 Steps involved in it

Get step-by-step solutions from verified subject matter experts