

Question: According to the probability density histogram shown below, what fraction of the sample had their x value between 2.5 and 11.5? Give your answer as
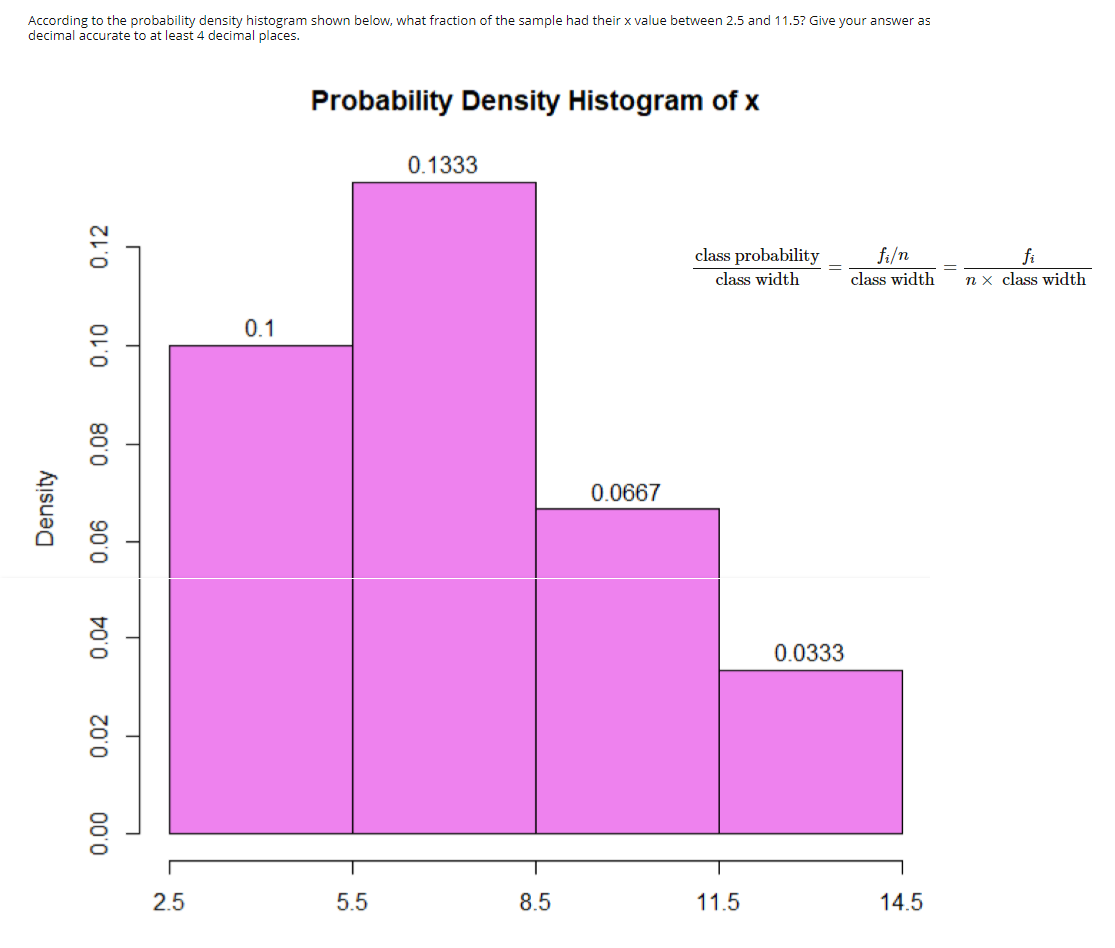
According to the probability density histogram shown below, what fraction of the sample had their x value between 2.5 and 11.5? Give your answer as decimal accurate to at least 4 decimal places. Probability Density Histogram of x 0.1333 class probability fi fi class width class width n x class width 0.10 0.12 0.1 0.08 0.0667 Density 0.06 0.04 0.0333 0.02 0.00 2.5 5.5 8.5 11.5 14.5
Step by Step Solution
There are 3 Steps involved in it
1 Expert Approved Answer
Step: 1 Unlock

Question Has Been Solved by an Expert!
Get step-by-step solutions from verified subject matter experts
Step: 2 Unlock
Step: 3 Unlock