

Question: 3. The figure below (Fig.1) shows the fracture surfaces for two different charpy test results of 316L stainless steel. According to these fracture surfaces,
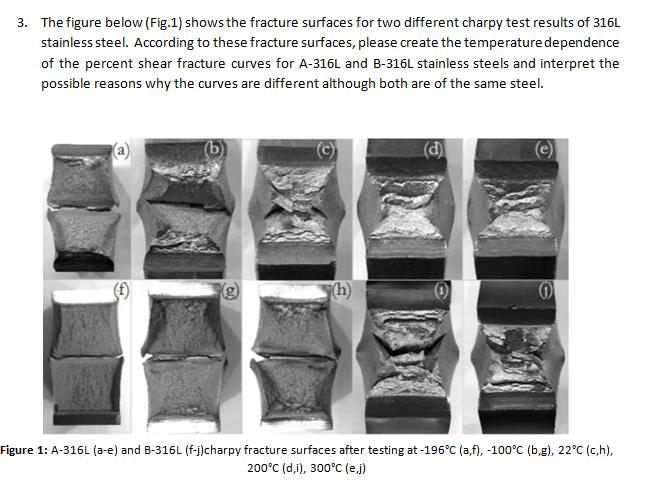
3. The figure below (Fig.1) shows the fracture surfaces for two different charpy test results of 316L stainless steel. According to these fracture surfaces, please create the temperature dependence of the percent shear fracture curves for A-316L and B-316L stainless steels and interpret the possible reasons why the curves are different although both are of the same steel. (e) (h) Figure 1: A-316L (a-e) and B-316L (f-j)charpy fracture surfaces after testing at -196C (a,f), -100C (b,g), 22C (c,h), 200C (d,i), 300C (e.j)
Step by Step Solution
3.52 Rating (162 Votes )
There are 3 Steps involved in it
The figure above shows the fracture surfaces for two different charpy test results of 316L sta... View full answer

Get step-by-step solutions from verified subject matter experts