

Question: according to this picture, explain this chart and explain Current MV / BV between these company investors are paying for each dollar in net assets.
according to this picture, explain this chart and explain Current MV / BV between these company
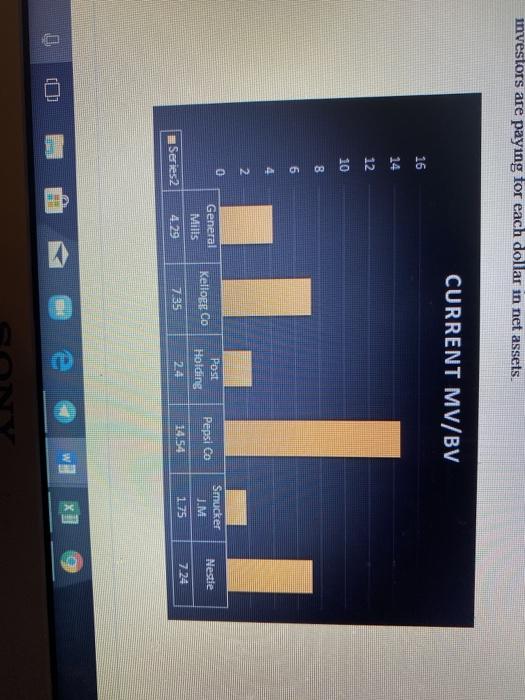
investors are paying for each dollar in net assets. CURRENT MV/BV 16 14 12 10 8 ch 4 2 General Mills Post Holding Kellogg Co Nestle Pepsi Co Smucker J.M 7.24 1.75 14.54 24 7.35 4.29 Series2 SHE D
Step by Step Solution
There are 3 Steps involved in it
1 Expert Approved Answer
Step: 1 Unlock

Question Has Been Solved by an Expert!
Get step-by-step solutions from verified subject matter experts
Step: 2 Unlock
Step: 3 Unlock