

The production of wine is a multibillion-dollar worldwide industry. In an attempt to develop a model...
Fantastic news! We've Found the answer you've been seeking!
Question:
Transcribed Image Text:
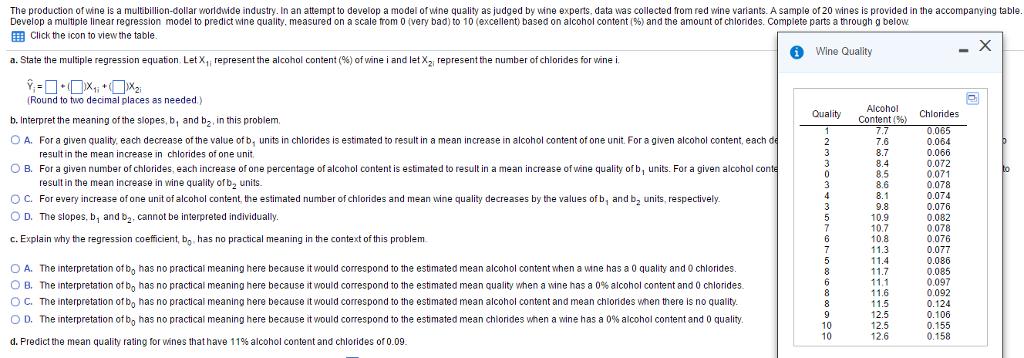
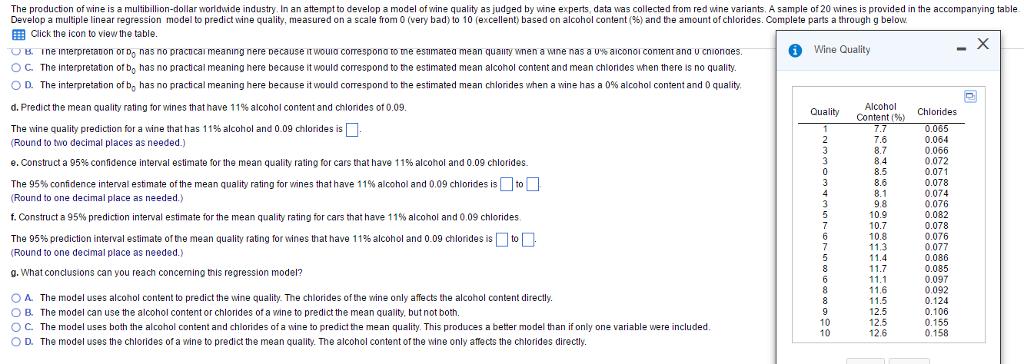
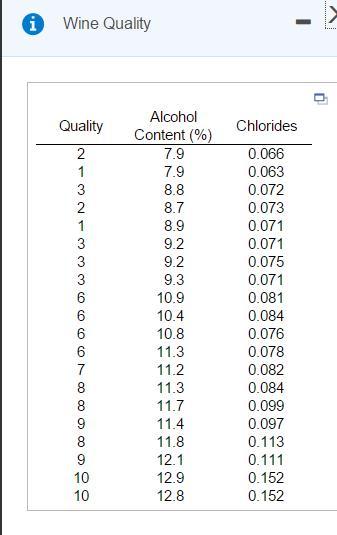
The production of wine is a multibillion-dollar worldwide industry. In an attempt to develop a model of wine quality as judged by wine experts, data was collected from red wine variants. A sample of 20 wines is provided in the accompanying table. Develop a muitiple linear regression model to predict wine quality, measured on a scale from 0 (very bad) to 10 (excellent) based on alcohol content (%) and the amount of chlorides. Complete parts a through g below. E Click the icon to view the table. Wine Quality a. State the multiple regression equation. Let X, represent the alcohol content (%) of wine i and let X2, represent the number of chlorides for wine i. -ロロ×*ロXa。 (Round to two decimal places as needed.) Alcohol Quality Chlorides b. Interpret the meaning of the slopes, b, and bz, in this problem. Content (%) 7.7 O A. For a given quality, each decrease of the value of b, units in chlorides is estimated to result in a mean increase in alcohol content of one unit. For a given alcohol content, each de result in the mean increase in chlorides of one unit. O B. For a given number of chlorides, each increase of one percentage of alcohol content is estimated to result in a mean increase of wine quality of b, units. For a given alcohol conte result in the mean increase in wine quality of b2 units. 0.065 0.064 0.066 0.072 0.071 0.078 7.6 3 8.7 3 8.4 8.5 8.6 3 8.1 0.074 OC. For every increase of one unit of alcohol content, the estimated number of chiorides and mean wine quality decreases by the values of b, and b, units, respectively. O D. The slopes, b, and b2, cannot be interpreted individually. 3 9.8 0.076 5 7. 10.9 10.7 0.082 0.078 0.076 c. Explain why the regression coefficient, b, has no practical meaning in the context of this problem 6. 10.8 ア 11.3 0.077 11.4 0.086 O A. The interpretation of b, has no practical meaning here because it would correspond to the estimated mean alcohol content when a wine has a 0 quality and O chlorides. O B. The interpretation of b, has no practical meaning here because it would correspond to the estimated mean quality when a wine has a 0% alcohol content and 0 chlorides. 8. 11.7 0.085 0.097 0.092 0.124 11.1 8 11.6 11.5 12.5 OC. The interpretation of b, has no practical meaning here because it would correspond to the estimated mean alcohol content and mean chlorides when there is no quality. 8 9 0.106 O D. The interpretation of b, has no practical meaning here because it would correspond to the estimated mean chiorides when a wine has a 0% alcohol content and 0 quality. 10 12.5 0.155 10 12.6 0.158 d. Predict the mean quality rating for wines that have 11% alcohol content and chlorides of 0.09. The production of wine is a multibillion-dollar worldwide industry. In an attempt to develop a model of wine quality as judged by wine experts, data was collected from red wine variants, A sample of 20 wines is provided in the accompanying table Develop a multiple linear regression model to predict wine quality, measured on a scale from 0 (very bad) to 10 (excellent) based on alcohol content (%) and the amount of chlorides. Complete parts a through g below. A Click the icon to view the table. X O Wine Quality Ine interpretaton or D, nas no pracncai meanıng nere pecause it woura correspona to tne estimatea mean quaity wnen a wine nas a u% aiconoi content ana u cnionaes. OC. The interpretation of b, has no practical meaning here because it would correspond to the estimated mean alcohol content and mean chlorides when there is no quality. OD. The interpretation of b, has no practical meaning here because it would correspond to the estimated mean chlorides when a wine has a 0% alcohol content and 0 quality. d. Predict the mean quality rating for wines that have 11% alcohol content and chlorides of 0.09. Alcohol Quality Chlorides Content (%) The wine quality prediction for a wine that has 11% alcohol and 0.09 chlorides is- 7.7 0.065 7.6 0.064 0.066 0.072 0.071 (Round to two decimal places as needed.) 8.7 8.4 8.5 e. Construct a 95% confidence interval estimate for the mean quality rating for cars that have 11% alcohol and 0.09 chlorides. The 95% confidence interval estimate of the mean quality rating for wines that have 11% alcohol and 0.09 chlorides is to 8.6 0.078 0.074 0.076 0.082 0.078 8.1 (Round to one decimal place as needed.) 9.8 10.9 f. Construct a 95% prediction interval estimate for the mean quality rating for cars that have 11% alcohol and 0.09 chlorides 10.7 10.8 11.3 11.4 11.7 0.076 0.077 0.086 The 95% prediction interval estimate of the mean quality rating for wines that have 11% alcohol and 0.09 chlorides is to 6. 7. (Round to one decimal place as needed.) 8. 0.085 g. What conclusions can you reach concerning this regression model? 11.1 11.6 11.5 0.097 0.092 0.124 0.106 0.155 0.158 OA The model uses alcohol content to predict the wine quality. The chlorides of the wine only affects the alcohol content directly. 8 OB. The model can use the alcohol content or chlorides of a wine to predict the mean quality, but not both. OC. The model uses both the alcohol content and chlorides of a wine to predict the mean quality. This produces a better model than if only one variable were included. OD. The model uses the chlorides of a wine to predict the mean quality. The alcohol content of the wine only affects the chlorides directly. 12.5 10 10 12.5 12.6 Wine Quality Alcohol Quality Chlorides Content (%) 7.9 0.066 1 7.9 0.063 0.072 0.073 3 8.8 8.7 1 8.9 0.071 3 9.2 0.071 3 9.2 0.075 3 9.3 0.071 6 10.9 0.081 6 10.4 0.084 6 10.8 0.076 6 11.3 0.078 7 11.2 0.082 11.3 11.7 11.4 8 0.084 8. 0.099 9. 0.097 8 11.8 0.113 9 12.1 0.111 10 12.9 0.152 10 12.8 0.152 The production of wine is a multibillion-dollar worldwide industry. In an attempt to develop a model of wine quality as judged by wine experts, data was collected from red wine variants. A sample of 20 wines is provided in the accompanying table. Develop a muitiple linear regression model to predict wine quality, measured on a scale from 0 (very bad) to 10 (excellent) based on alcohol content (%) and the amount of chlorides. Complete parts a through g below. E Click the icon to view the table. Wine Quality a. State the multiple regression equation. Let X, represent the alcohol content (%) of wine i and let X2, represent the number of chlorides for wine i. -ロロ×*ロXa。 (Round to two decimal places as needed.) Alcohol Quality Chlorides b. Interpret the meaning of the slopes, b, and bz, in this problem. Content (%) 7.7 O A. For a given quality, each decrease of the value of b, units in chlorides is estimated to result in a mean increase in alcohol content of one unit. For a given alcohol content, each de result in the mean increase in chlorides of one unit. O B. For a given number of chlorides, each increase of one percentage of alcohol content is estimated to result in a mean increase of wine quality of b, units. For a given alcohol conte result in the mean increase in wine quality of b2 units. 0.065 0.064 0.066 0.072 0.071 0.078 7.6 3 8.7 3 8.4 8.5 8.6 3 8.1 0.074 OC. For every increase of one unit of alcohol content, the estimated number of chiorides and mean wine quality decreases by the values of b, and b, units, respectively. O D. The slopes, b, and b2, cannot be interpreted individually. 3 9.8 0.076 5 7. 10.9 10.7 0.082 0.078 0.076 c. Explain why the regression coefficient, b, has no practical meaning in the context of this problem 6. 10.8 ア 11.3 0.077 11.4 0.086 O A. The interpretation of b, has no practical meaning here because it would correspond to the estimated mean alcohol content when a wine has a 0 quality and O chlorides. O B. The interpretation of b, has no practical meaning here because it would correspond to the estimated mean quality when a wine has a 0% alcohol content and 0 chlorides. 8. 11.7 0.085 0.097 0.092 0.124 11.1 8 11.6 11.5 12.5 OC. The interpretation of b, has no practical meaning here because it would correspond to the estimated mean alcohol content and mean chlorides when there is no quality. 8 9 0.106 O D. The interpretation of b, has no practical meaning here because it would correspond to the estimated mean chiorides when a wine has a 0% alcohol content and 0 quality. 10 12.5 0.155 10 12.6 0.158 d. Predict the mean quality rating for wines that have 11% alcohol content and chlorides of 0.09. The production of wine is a multibillion-dollar worldwide industry. In an attempt to develop a model of wine quality as judged by wine experts, data was collected from red wine variants, A sample of 20 wines is provided in the accompanying table Develop a multiple linear regression model to predict wine quality, measured on a scale from 0 (very bad) to 10 (excellent) based on alcohol content (%) and the amount of chlorides. Complete parts a through g below. A Click the icon to view the table. X O Wine Quality Ine interpretaton or D, nas no pracncai meanıng nere pecause it woura correspona to tne estimatea mean quaity wnen a wine nas a u% aiconoi content ana u cnionaes. OC. The interpretation of b, has no practical meaning here because it would correspond to the estimated mean alcohol content and mean chlorides when there is no quality. OD. The interpretation of b, has no practical meaning here because it would correspond to the estimated mean chlorides when a wine has a 0% alcohol content and 0 quality. d. Predict the mean quality rating for wines that have 11% alcohol content and chlorides of 0.09. Alcohol Quality Chlorides Content (%) The wine quality prediction for a wine that has 11% alcohol and 0.09 chlorides is- 7.7 0.065 7.6 0.064 0.066 0.072 0.071 (Round to two decimal places as needed.) 8.7 8.4 8.5 e. Construct a 95% confidence interval estimate for the mean quality rating for cars that have 11% alcohol and 0.09 chlorides. The 95% confidence interval estimate of the mean quality rating for wines that have 11% alcohol and 0.09 chlorides is to 8.6 0.078 0.074 0.076 0.082 0.078 8.1 (Round to one decimal place as needed.) 9.8 10.9 f. Construct a 95% prediction interval estimate for the mean quality rating for cars that have 11% alcohol and 0.09 chlorides 10.7 10.8 11.3 11.4 11.7 0.076 0.077 0.086 The 95% prediction interval estimate of the mean quality rating for wines that have 11% alcohol and 0.09 chlorides is to 6. 7. (Round to one decimal place as needed.) 8. 0.085 g. What conclusions can you reach concerning this regression model? 11.1 11.6 11.5 0.097 0.092 0.124 0.106 0.155 0.158 OA The model uses alcohol content to predict the wine quality. The chlorides of the wine only affects the alcohol content directly. 8 OB. The model can use the alcohol content or chlorides of a wine to predict the mean quality, but not both. OC. The model uses both the alcohol content and chlorides of a wine to predict the mean quality. This produces a better model than if only one variable were included. OD. The model uses the chlorides of a wine to predict the mean quality. The alcohol content of the wine only affects the chlorides directly. 12.5 10 10 12.5 12.6 Wine Quality Alcohol Quality Chlorides Content (%) 7.9 0.066 1 7.9 0.063 0.072 0.073 3 8.8 8.7 1 8.9 0.071 3 9.2 0.071 3 9.2 0.075 3 9.3 0.071 6 10.9 0.081 6 10.4 0.084 6 10.8 0.076 6 11.3 0.078 7 11.2 0.082 11.3 11.7 11.4 8 0.084 8. 0.099 9. 0.097 8 11.8 0.113 9 12.1 0.111 10 12.9 0.152 10 12.8 0.152
Expert Answer:

Related Book For 

Basic Business Statistics
ISBN: 978-0321870025
13th edition
Authors: Mark L. Berenson, David M. Levine, Kathryn A. Szabat
Posted Date:
Students also viewed these mathematics questions
-
The production of wine is a multibillion dollar worldwide industry. In an attempt to develop a model of wine quality as judged by wine experts, data was collected from red wine variants of Portuguese...
-
The production of wine is a multibillion dollar worldwide industry. In an attempt to develop a model of wine quality as judged by wine experts, data was collected from red wine variants of Portuguese...
-
The production of wine is a multibillion-dollar worldwide industry. In an attempt to develop a model of wine quality as judged by wine experts, data was collected from red wine variants of Portuguese...
-
1. If net profit is $47,025; depreciation is $2,200; accounts receivable increases $5,056; accounts payable increases $4,673; and inventory declines $850; what is the operating cash flow for the...
-
Assume numbers are represented in 8-bit twos complement representation. Show the calculation of the following: a. 6 + 13 b. -6 + 13 c. 6 - 13 d. -6 - 13
-
Consider a floating-point format with 8 bits for the biased exponent and 23 bits for the significand. Show the bit pattern for the following numbers in this format: a. -720 b. 0.645
-
A senior VP has proposed that "we pay too much tax, so we should issue new debt and use the proceeds to buy back common stock." What would be the logic behind this statement?
-
The management of Coker Corp is doing a quick forecast of 20X9 using the modified percentage of sales method in preparation for a more detailed planning exercise later in the month. The estimate is...
-
Suppose that there are three firms in a region that are producing a common emission. The marginal abatement cost (MAC) for each firm is given by: MAC1 240-2E1 MAC2 192-1.6E2 MAC3 = 320 -2.67E3 The...
-
The beam shown in Figure P567 carries a repeated, reversed load of 400 N applied at section C. Compute the resulting design factor if the beam is made from SAE 1340 OQT 1300. Data in Figure P567. 12...
-
A large furniture company has six retail locations spread out across Ontario and Quebec. To better serve these retail locations, the company has decided to open new distribution centers to supply...
-
What does a foot-candle measure?
-
Now review the audit report of the 2022 financial report. State what type of opinion was expressed? Are there any additional sections or paragraphs indicating any audit issues? What key audit matters...
-
The compensation specialist has been asked to review all of the performance ratings given by department heads and highlight an irregularities to the director. They notice that one department has...
-
What would be the independent and dependent variable in all four hypothesis? Hypothesis 1: Sleep quantity is positively associated with organizational citizenship behavior directed toward individuals...
-
As an auditor, you are required to write a letter to a client, you explain the operation of corporation tax by demonstrating an understanding of the underpinning concepts. You must use a range of...
-
Parent Inc. purchased 70% of Sub Corp. on October 1, 20X1. The assets were transferred on a carryover basis from Sub Corp to Parent Inc on the date of acquisition. On that date, Sub Corp had patents...
-
Outline a general process applicable to most control situations. Using this, explain how you would develop a system to control home delivery staff at a local pizza shop.
-
A sample of 30 houses recently listed for sale in Silver Spring, Maryland, was selected with the objective of developing a model to predict the assessed value (in $thousands), using the size of the...
-
The value of a National Basketball Association (NBA) franchise has increased dramatically over the past few years. The value of a franchise varies based on the size of the city in which the team is...
-
The file Currency2 contains the value of the Canadian dollar, English pound, and Euro for one U.S. dollar from 2002 to 2012. a. Construct sparklines for the value of the U.S. dollar in terms of the...
-
A nickel crystals work function is measured to be 5.22 eV at 25C. As the temperature increases by 300C, the work function drops by 50 meV. By how much does this shift the threshold wavelength for...
-
A crystal sample of bacteriorhodpsin, a light-sensitive protein found in halobacteria that responds to light energy, has crystal planes separated by 0.20 nm. If a beam of 11 keV x rays illuminates a...
-
Investigators have created structures consisting of linear chains of ionized atoms on a smooth surface. Electrons are restricted to travel along the chain. The energy levels of the electrons match...

Study smarter with the SolutionInn App