

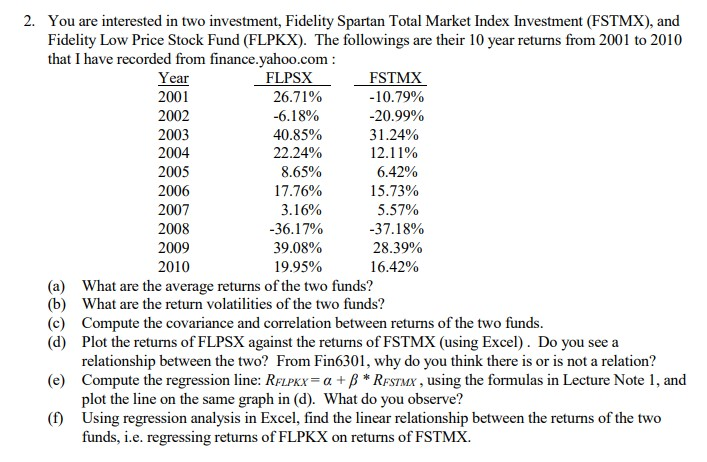
2. You are interested in two investment, Fidelity Spartan Total Market Index Investment (FSTMX), and Fidelity...
Fantastic news! We've Found the answer you've been seeking!
Question:
Expert Answer:
From given information a The average of two fund is Average of FSTMX 469 and Ave... View the full answer

Related Book For 

Principles Of Managerial Finance
ISBN: 978-0136119463
13th Edition
Authors: Lawrence J. Gitman, Chad J. Zutter
Posted Date:
