

Question: A box office analyst seeks to predict opening weekend box office gross for movies. Toward this goal, the analyst plans to use online trailer views
A box office analyst seeks to predict opening weekend box office gross for movies. Toward this goal, the analyst plans to use online trailer views as a predictor. For each of the 6666 movies, the number of online trailer views from the release of the trailer through the Saturday before a movie opens and the opening weekend box office gross (in millions of dollars) are collected and stored in the accompanying table. Complete parts (a) through (e) below. Online Trailer Views (millions) Opening Weekend Box Office GrossOnline Trailer Views (millions) Opening Weekend Box Office Gross ($millions) 55.749 34.748 6.635 3.772 11.948 9.747 35.872 63.289 9.084 5.918 5.243 15.858 5.88 23.806 46.439 90.677 85.046 105.25 4.989 4.69 36.469 61.557 6.63 33.377 20.034 17.696 0.942 3.705 5.914 10.963 2.258 1.513 3.1 3.185 11.327 18.47 43.634 37.319 8.966 12.202 5.138 23.505 15.177 4.357 28.771 16.566 13.714 30.436 3.963 0.013 31.231 53.003 59.077 150.248 52.612 46.607 4.404 8.431 16.235 13.003 12.817 5.792 6.884 3.776 11.284 2.408 11.698 18.223 0.661 8.098 2.827 3.471 1.602 4.327 23.075 13.602 5.341 6.549 12.606 40.011 9.088 4.888 0.826 1.385 8.809 4.321 27.536 20.13 29.911 96.638 7.273 3.404 0.612 4.837 3.323 1.207 0.141 11.834 4.267 10.951 9.626 14.864 3.79 8.344 52.543 48.157 7.597 11.614 1.599 4.887 12.912 13.501 31.528 20.767 7.067 5.106 7.092 5.188 5.02 1.985 12.237 14.209 7.739 22.8 56.764 40.708 16.795 13.689 79.141 175.683 7.643 2.08 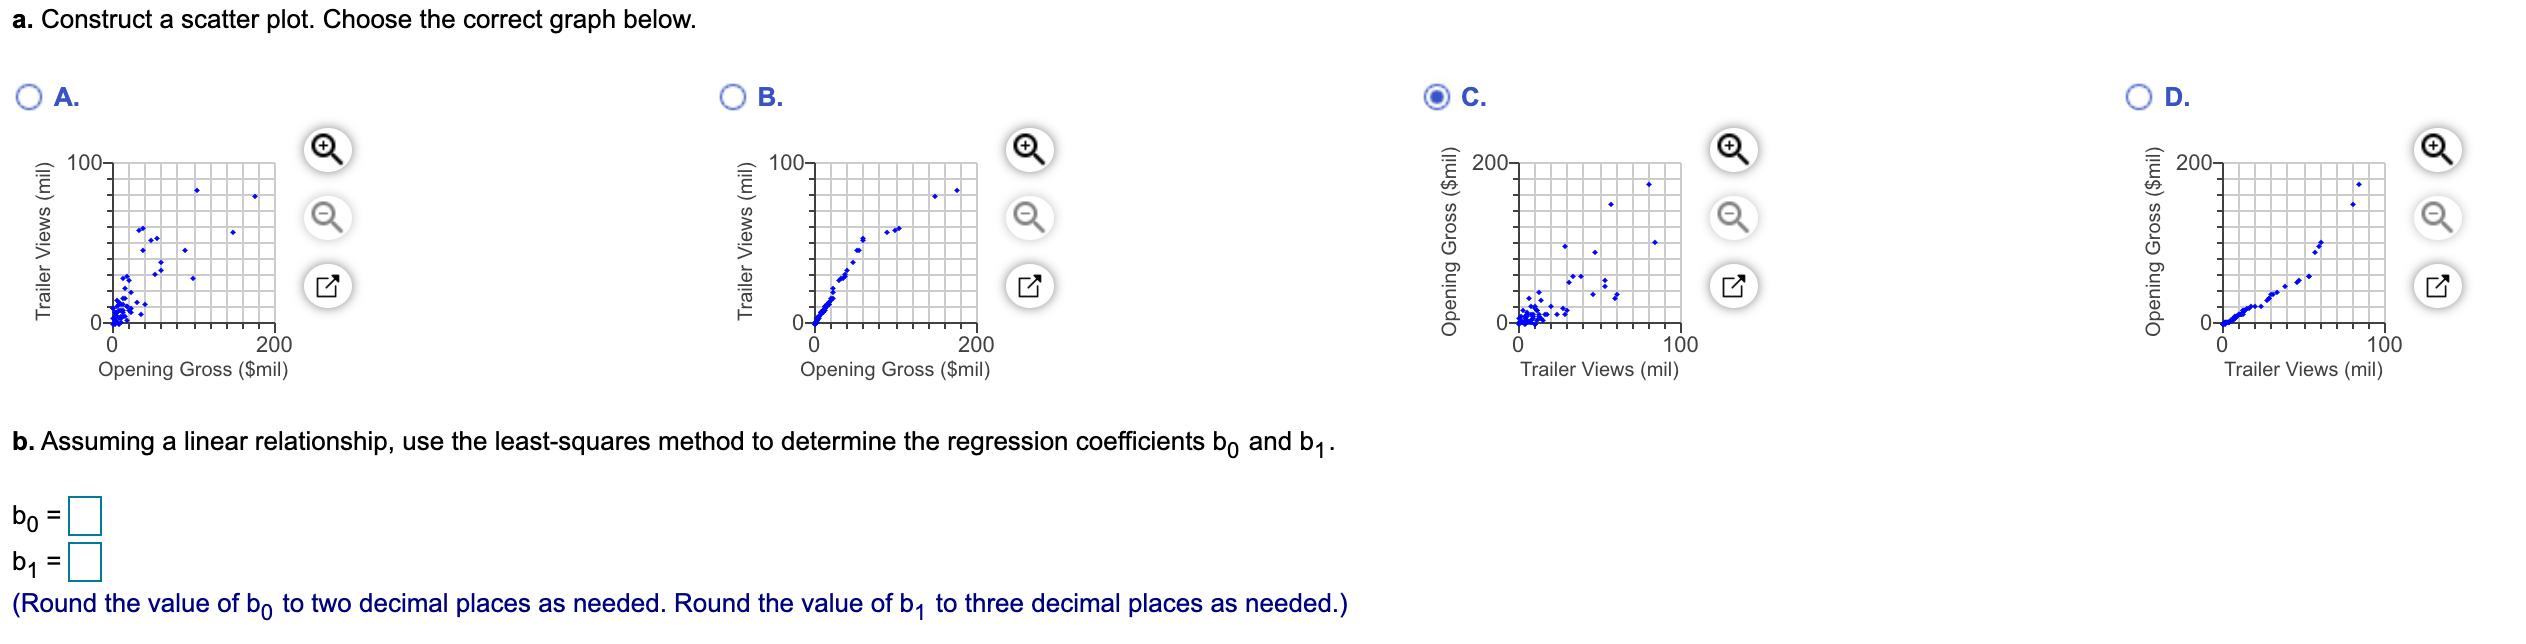
a. Construct a scatter plot. Choose the correct graph below. A. . C. D. 100- 100- 200- 200- 100 Trailer Views (mil) 100 Trailer Views (mil) 200 200 Opening Gross ($mil) Opening Gross ($mil) b. Assuming a linear relationship, use the least-squares method to determine the regression coefficients bo and b,. bo %3D %D (Round the value of bo to two decimal places as needed. Round the value of b, to three decimal places as needed.) Opening Gross ($mil)
Step by Step Solution
3.50 Rating (157 Votes )
There are 3 Steps involved in it
Interpretation The scatter plot illustrates that there exists a positive li... View full answer

Get step-by-step solutions from verified subject matter experts