

A spreadsheet supplement is available on Canvas. Most calculations, and explanations of calculations, can be provided...
Fantastic news! We've Found the answer you've been seeking!
Question:
Transcribed Image Text:
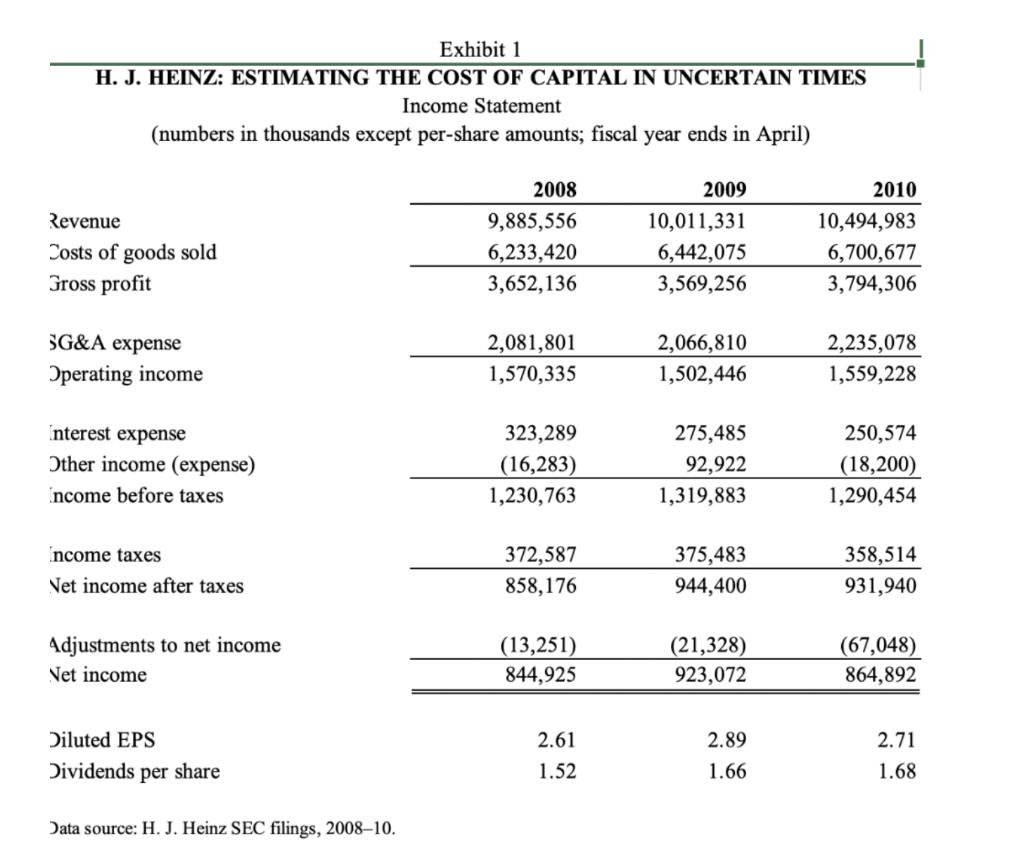
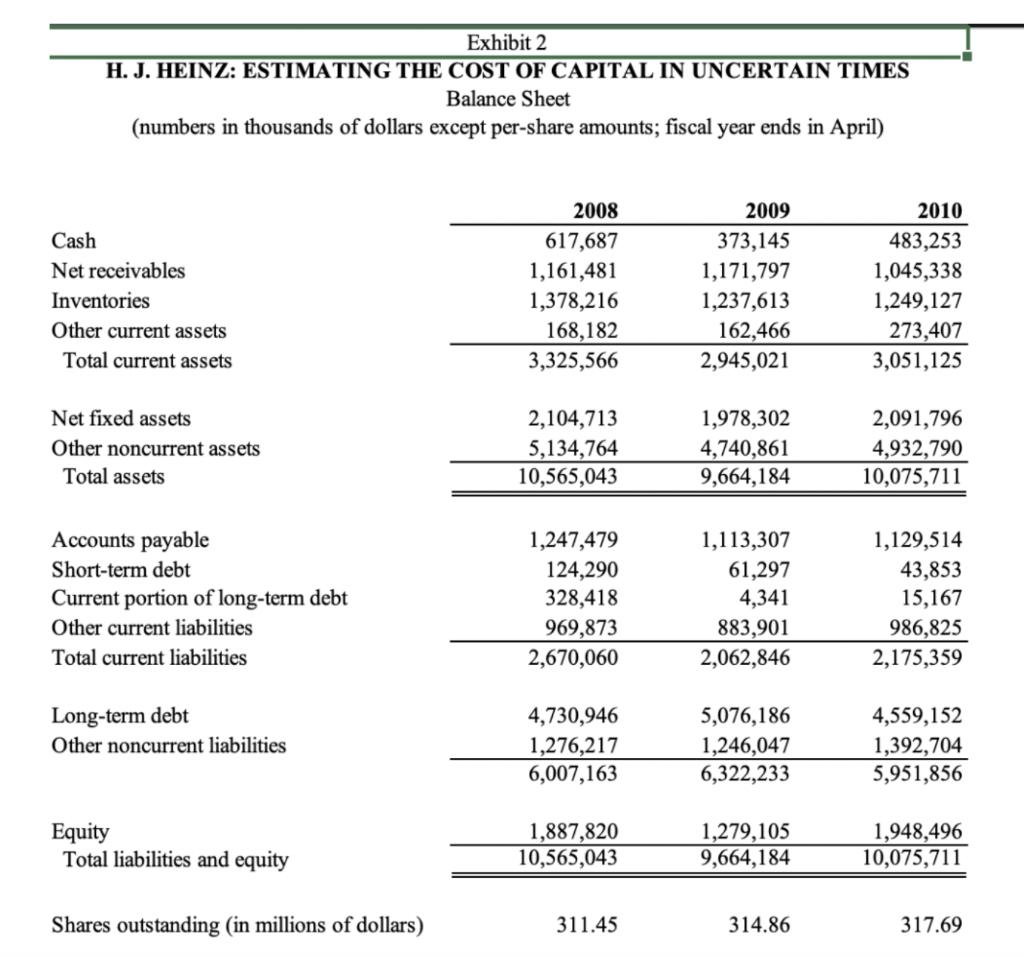
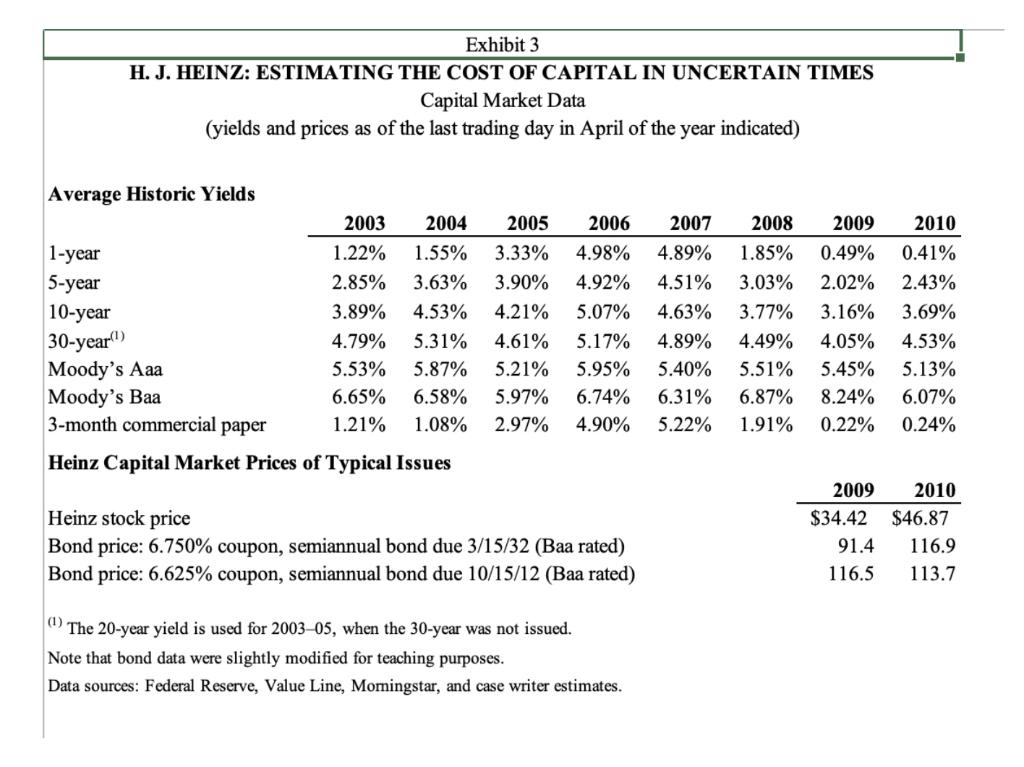
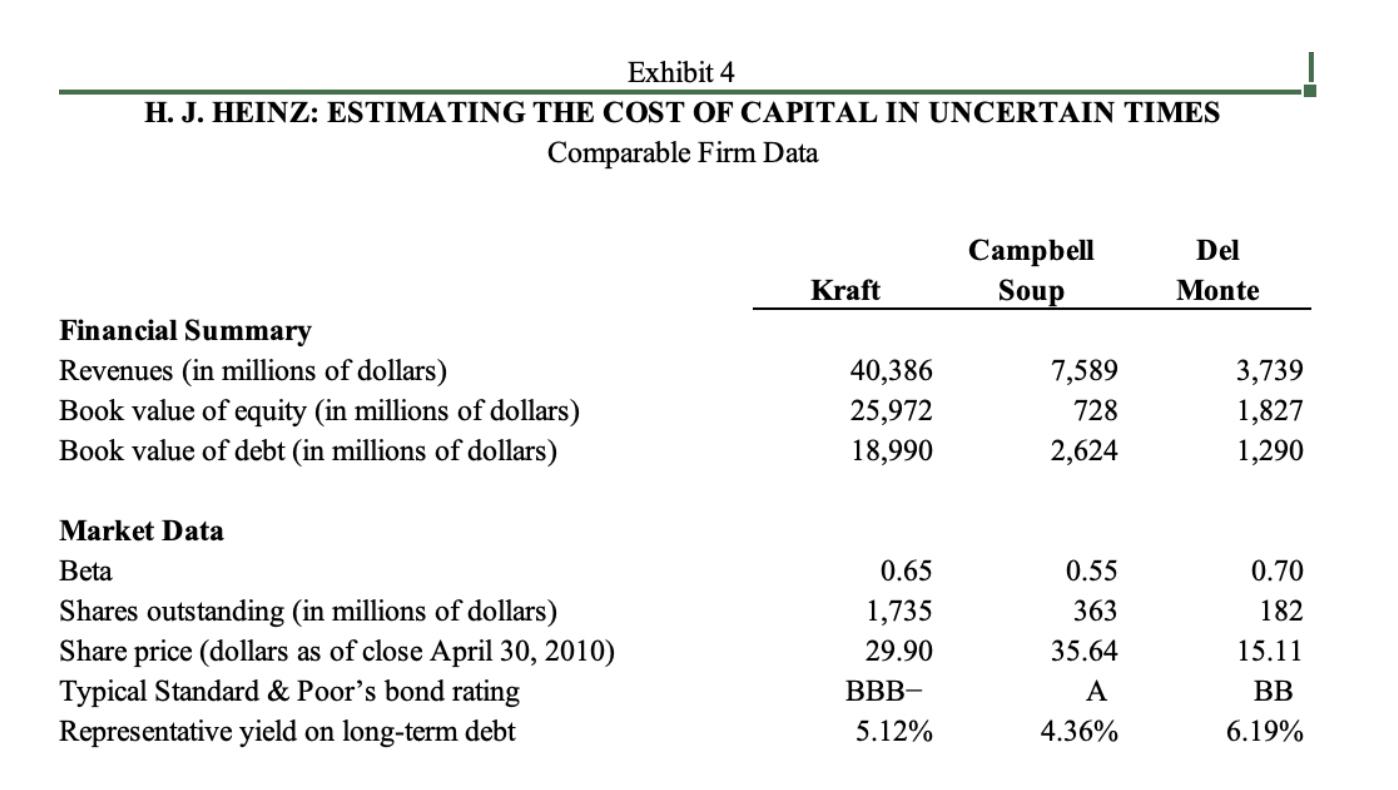
A spreadsheet supplement is available on Canvas. Most calculations, and explanations of calculations, can be provided as exhibits to your writeup. Please remember to post only PDF files to Canvas. | Please prepare the following in your writeup. It is also helpful to have a copy with you during class to be able to participate in our discussion. 1) Calculate the yield to maturity (YTM) on the two representative bonds for both of the years given (you can assume a full six months until the next coupon payment). Exhibit 1 H. J. HEINZ: ESTIMATING THE COST OF CAPITAL IN UNCERTAIN TIMES Income Statement (numbers in thousands except per-share amounts; fiscal year ends in April) 2008 2009 Revenue Costs of goods sold Gross profit 9,885,556 10,011,331 2010 10,494,983 6,233,420 6,442,075 6,700,677 3,652,136 3,569,256 3,794,306 SG&A expense 2,081,801 2,066,810 2,235,078 Operating income 1,570,335 1,502,446 1,559,228 Interest expense 323,289 275,485 250,574 Other income (expense) (16,283) 92,922 (18,200) Income before taxes 1,230,763 1,319,883 1,290,454 Income taxes 372,587 375,483 358,514 Net income after taxes 858,176 944,400 931,940 Adjustments to net income (13,251) (21,328) (67,048) Net income 844,925 923,072 864,892 Diluted EPS Dividends per share Data source: H. J. Heinz SEC filings, 2008-10. 2.61 2.89 2.71 1.52 1.66 1.68 Exhibit 2 H. J. HEINZ: ESTIMATING THE COST OF CAPITAL IN UNCERTAIN TIMES Balance Sheet (numbers in thousands of dollars except per-share amounts; fiscal year ends in April) 2008 2009 Cash 617,687 373,145 2010 483,253 Net receivables 1,161,481 1,171,797 1,045,338 Inventories 1,378,216 1,237,613 1,249,127 Other current assets 168,182 162,466 273,407 Total current assets 3,325,566 2,945,021 3,051,125 Net fixed assets 2,104,713 1,978,302 2,091,796 Other noncurrent assets 5,134,764 4,740,861 4,932,790 Total assets 10,565,043 9,664,184 10,075,711 Accounts payable 1,247,479 1,113,307 1,129,514 Short-term debt 124,290 61,297 43,853 Current portion of long-term debt 328,418 4,341 15,167 Other current liabilities 969,873 883,901 986,825 Total current liabilities 2,670,060 2,062,846 2,175,359 Long-term debt 4,730,946 5,076,186 4,559,152 Other noncurrent liabilities 1,276,217 1,246,047 1,392,704 6,007,163 6,322,233 5,951,856 Equity 1,887,820 1,279,105 1,948,496 Total liabilities and equity 10,565,043 9,664,184 10,075,711 Shares outstanding (in millions of dollars) 311.45 314.86 317.69 Exhibit 3 H. J. HEINZ: ESTIMATING THE COST OF CAPITAL IN UNCERTAIN TIMES Capital Market Data (yields and prices as of the last trading day in April of the year indicated) Average Historic Yields 1-year 5-year 10-year 30-year(1) Moody's Aaa Moody's Baa 3-month commercial paper 2003 2004 2005 2006 2007 2008 2009 2010 1.22% 1.55% 3.33% 4.98% 4.89% 1.85% 0.49% 0.41% 2.85% 3.63% 3.90% 4.92% 4.51% 3.03% 2.02% 2.43% 3.89% 4.53% 4.21% 5.07% 4.63% 3.77% 3.16% 3.69% 4.79% 5.31% 4.61% 5.17% 4.89% 4.49% 4.05% 4.53% 5.53% 5.87% 5.21% 5.95% 5.40% 5.51% 5.45% 5.13% 6.65% 6.58% 5.97% 6.74% 6.31% 6.87% 8.24% 6.07% 1.21% 1.08% 2.97% 4.90% 5.22% 1.91% 0.22% 0.24% Heinz Capital Market Prices of Typical Issues Heinz stock price Bond price: 6.750% coupon, semiannual bond due 3/15/32 (Baa rated) Bond price: 6.625% coupon, semiannual bond due 10/15/12 (Baa rated) (1) The 20-year yield is used for 2003-05, when the 30-year was not issued. Note that bond data were slightly modified for teaching purposes. Data sources: Federal Reserve, Value Line, Momingstar, and case writer estimates. 2009 2010 $34.42 $46.87 91.4 116.9 116.5 113.7 Exhibit 4 H. J. HEINZ: ESTIMATING THE COST OF CAPITAL IN UNCERTAIN TIMES Comparable Firm Data Campbell Del Kraft Soup Monte Financial Summary Revenues (in millions of dollars) 40,386 7,589 3,739 Book value of equity (in millions of dollars) 25,972 728 1,827 Book value of debt (in millions of dollars) 18,990 2,624 1,290 Market Data Beta 0.65 0.55 0.70 Shares outstanding (in millions of dollars) 1,735 363 182 Share price (dollars as of close April 30, 2010) 29.90 35.64 15.11 Typical Standard & Poor's bond rating BBB- A BB Representative yield on long-term debt 5.12% 4.36% 6.19% A spreadsheet supplement is available on Canvas. Most calculations, and explanations of calculations, can be provided as exhibits to your writeup. Please remember to post only PDF files to Canvas. | Please prepare the following in your writeup. It is also helpful to have a copy with you during class to be able to participate in our discussion. 1) Calculate the yield to maturity (YTM) on the two representative bonds for both of the years given (you can assume a full six months until the next coupon payment). Exhibit 1 H. J. HEINZ: ESTIMATING THE COST OF CAPITAL IN UNCERTAIN TIMES Income Statement (numbers in thousands except per-share amounts; fiscal year ends in April) 2008 2009 Revenue Costs of goods sold Gross profit 9,885,556 10,011,331 2010 10,494,983 6,233,420 6,442,075 6,700,677 3,652,136 3,569,256 3,794,306 SG&A expense 2,081,801 2,066,810 2,235,078 Operating income 1,570,335 1,502,446 1,559,228 Interest expense 323,289 275,485 250,574 Other income (expense) (16,283) 92,922 (18,200) Income before taxes 1,230,763 1,319,883 1,290,454 Income taxes 372,587 375,483 358,514 Net income after taxes 858,176 944,400 931,940 Adjustments to net income (13,251) (21,328) (67,048) Net income 844,925 923,072 864,892 Diluted EPS Dividends per share Data source: H. J. Heinz SEC filings, 2008-10. 2.61 2.89 2.71 1.52 1.66 1.68 Exhibit 2 H. J. HEINZ: ESTIMATING THE COST OF CAPITAL IN UNCERTAIN TIMES Balance Sheet (numbers in thousands of dollars except per-share amounts; fiscal year ends in April) 2008 2009 Cash 617,687 373,145 2010 483,253 Net receivables 1,161,481 1,171,797 1,045,338 Inventories 1,378,216 1,237,613 1,249,127 Other current assets 168,182 162,466 273,407 Total current assets 3,325,566 2,945,021 3,051,125 Net fixed assets 2,104,713 1,978,302 2,091,796 Other noncurrent assets 5,134,764 4,740,861 4,932,790 Total assets 10,565,043 9,664,184 10,075,711 Accounts payable 1,247,479 1,113,307 1,129,514 Short-term debt 124,290 61,297 43,853 Current portion of long-term debt 328,418 4,341 15,167 Other current liabilities 969,873 883,901 986,825 Total current liabilities 2,670,060 2,062,846 2,175,359 Long-term debt 4,730,946 5,076,186 4,559,152 Other noncurrent liabilities 1,276,217 1,246,047 1,392,704 6,007,163 6,322,233 5,951,856 Equity 1,887,820 1,279,105 1,948,496 Total liabilities and equity 10,565,043 9,664,184 10,075,711 Shares outstanding (in millions of dollars) 311.45 314.86 317.69 Exhibit 3 H. J. HEINZ: ESTIMATING THE COST OF CAPITAL IN UNCERTAIN TIMES Capital Market Data (yields and prices as of the last trading day in April of the year indicated) Average Historic Yields 1-year 5-year 10-year 30-year(1) Moody's Aaa Moody's Baa 3-month commercial paper 2003 2004 2005 2006 2007 2008 2009 2010 1.22% 1.55% 3.33% 4.98% 4.89% 1.85% 0.49% 0.41% 2.85% 3.63% 3.90% 4.92% 4.51% 3.03% 2.02% 2.43% 3.89% 4.53% 4.21% 5.07% 4.63% 3.77% 3.16% 3.69% 4.79% 5.31% 4.61% 5.17% 4.89% 4.49% 4.05% 4.53% 5.53% 5.87% 5.21% 5.95% 5.40% 5.51% 5.45% 5.13% 6.65% 6.58% 5.97% 6.74% 6.31% 6.87% 8.24% 6.07% 1.21% 1.08% 2.97% 4.90% 5.22% 1.91% 0.22% 0.24% Heinz Capital Market Prices of Typical Issues Heinz stock price Bond price: 6.750% coupon, semiannual bond due 3/15/32 (Baa rated) Bond price: 6.625% coupon, semiannual bond due 10/15/12 (Baa rated) (1) The 20-year yield is used for 2003-05, when the 30-year was not issued. Note that bond data were slightly modified for teaching purposes. Data sources: Federal Reserve, Value Line, Momingstar, and case writer estimates. 2009 2010 $34.42 $46.87 91.4 116.9 116.5 113.7 Exhibit 4 H. J. HEINZ: ESTIMATING THE COST OF CAPITAL IN UNCERTAIN TIMES Comparable Firm Data Campbell Del Kraft Soup Monte Financial Summary Revenues (in millions of dollars) 40,386 7,589 3,739 Book value of equity (in millions of dollars) 25,972 728 1,827 Book value of debt (in millions of dollars) 18,990 2,624 1,290 Market Data Beta 0.65 0.55 0.70 Shares outstanding (in millions of dollars) 1,735 363 182 Share price (dollars as of close April 30, 2010) 29.90 35.64 15.11 Typical Standard & Poor's bond rating BBB- A BB Representative yield on long-term debt 5.12% 4.36% 6.19%
Expert Answer:
Answer rating: 100% (QA)
To calculate the yield to maturity YTM on the two representative bonds we need the following informa... View the full answer

Related Book For 
Cornerstones of Managerial Accounting
ISBN: 978-0324660135
3rd Edition
Authors: Mowen, Hansen, Heitger
Posted Date:
Students also viewed these finance questions
-
Read the case study Estimating the cost of capital Prepare a case study analysis, exhibits & include: 1) Identify the key problem(s) for which recommendation are needed. 2) Summarize the key...
-
In this mini-case, you will determine overall materiality as well as tolerable misstatement amounts for balance sheet accounts of EarthWear Clothiers, Inc. Most auditing firms use a simple approach...
-
As a manager, you are deciding on investing in a warehouse to deliver goods to local residential places. You bought a new vehicle for $25,000 and you are told that the service life of the such a...
-
Problem 3.6.1 Given the random variable Y in Problem 3.4.1, let U = g(Y) = Y2. (a) Find Pu(u). (b) Find Fu(u). (c) Find E[U].
-
Look up as many definitions of accounting as you can find, noting the source, country, original language and date of publication. Note and try to explain their differences.
-
Potash Corp, through Canpotex, has an order for 5,000 tons of potash from Sinofert, the largest fertilizer importer and distributor in China. How should this shipment be delivered (in terms of supply...
-
An engineering student has 6 different ball bearings and 9 different gears. In how many ways can 3 ball bearings and 3 gears be selected for an experiment on friction in machine parts?
-
In the fourth quarter of 2011, Casey Wholesalers had the following net income: Sales ..................................$600,000 Less cost of sales ............................. 300,000 Gross margin...
-
ces The most recent financial statements for Crosby, Incorporated, follow. Sales for 2021 are projected to grow by 25 percent. Interest expense will remain constant; the tax rate and the dividend...
-
Consider the following six months of returns for two stocks and a portfolio of those two stocks where you invest 50% of your wealth in Stock A and 50% in Stock B. What is the expected return and...
-
Write a paper that addresses the following prompt: the average U.S. CEO was paid approximately $12.94 million in 2011, while the average U.S. workers pay was approximately $34,000. 1. Is this...
-
List the four elements which specify the size of the Lathe.
-
Write advantages and disadvantages of Vapor Compression Cycle over Air Refrigeration Cycle.
-
The pressure difference across the wall of a blood vessel is called transmural pressure. Suppose an aorta of radius \(11 \mathrm{~mm}\) has a transmural pressure of \(12 \mathrm{kPa}\) and a...
-
Find the expression for the work done by impeller of a centrifugal pump on water per second per unit weight of water.
-
Explain the structure and working of four-stroke diesel engine with a neat sketch.
-
Examine the C programming segment given below. What is the correct answer from the given responses? struct wind char wname [10]; double speed; int grid; }; int main(void) } struct wind w[100]; 13
-
Wal-Mart is the second largest retailer in the world. The data file on the disk holds monthly data on Wal-Marts revenue, along with several possibly related economic variables. a) Using computer...
-
Jean Erickson, manager and owner of an advertising company in Charlotte, North Carolina, had arranged a meeting with Leroy Gee, the chief accountant of a large, local competitor. The two are lifelong...
-
Leakam Companys product engineering department has developed a new product that has a three-year life cycle. Production of the product requires development of a new process that requires a current...
-
Multiple Choice Questions 1. Historical experience should be used with caution in setting standards because a. Most companies keep poor records. b. Ideal standards are always better than historical...
-
First-Year College GPA Researchers at the College Board wanted to build a model that describes one's first-year college GPA. The researchers obtained the following model: \[\hat{y}=0.06 x_{1}+0.07...
-
Find the upper and lower critical values at the \(\alpha=0.05\) level of significance from Table XI if \(n_{1}=10\) and \(n_{2}=5\). Approach Determine the intersection of the row corresponding to...
-
The data in Table 2 represent the monthly rates of return of the Standard and Poor's Index of 500 Stocks from January 2012 through March 2015. Test the randomness of positive monthly rates of return...

Study smarter with the SolutionInn App