

In January 1992, Eskimo Pie reported 1991 sales of $60,955,000 and net income of $3,749,000. Based...
Fantastic news! We've Found the answer you've been seeking!
Question:
Transcribed Image Text:
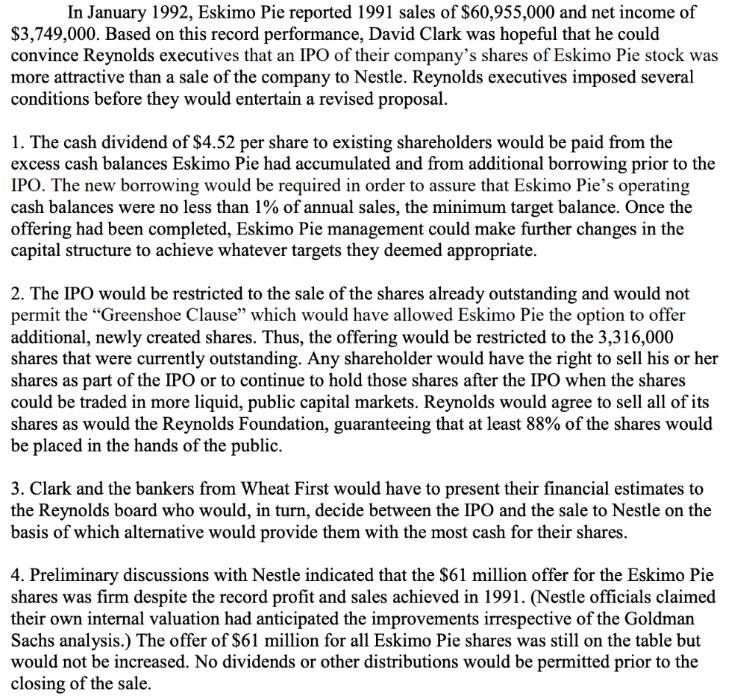
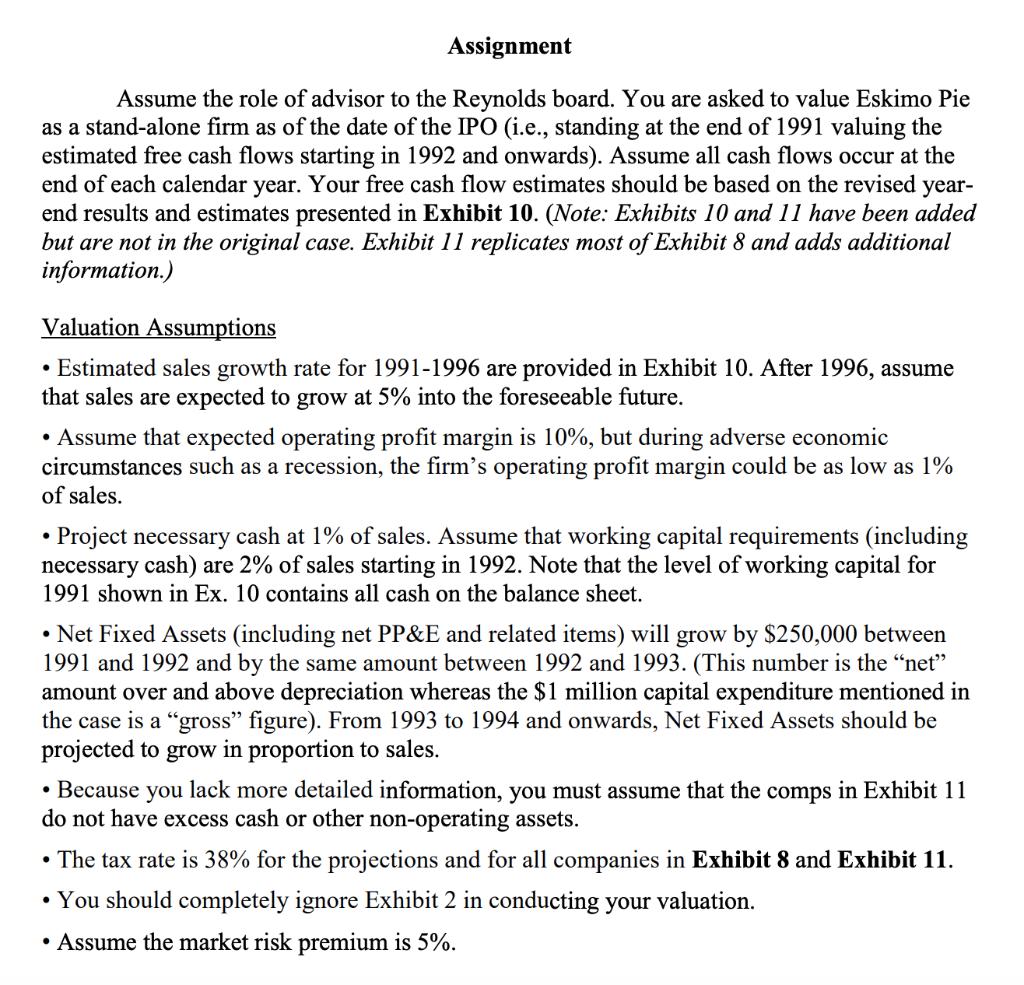
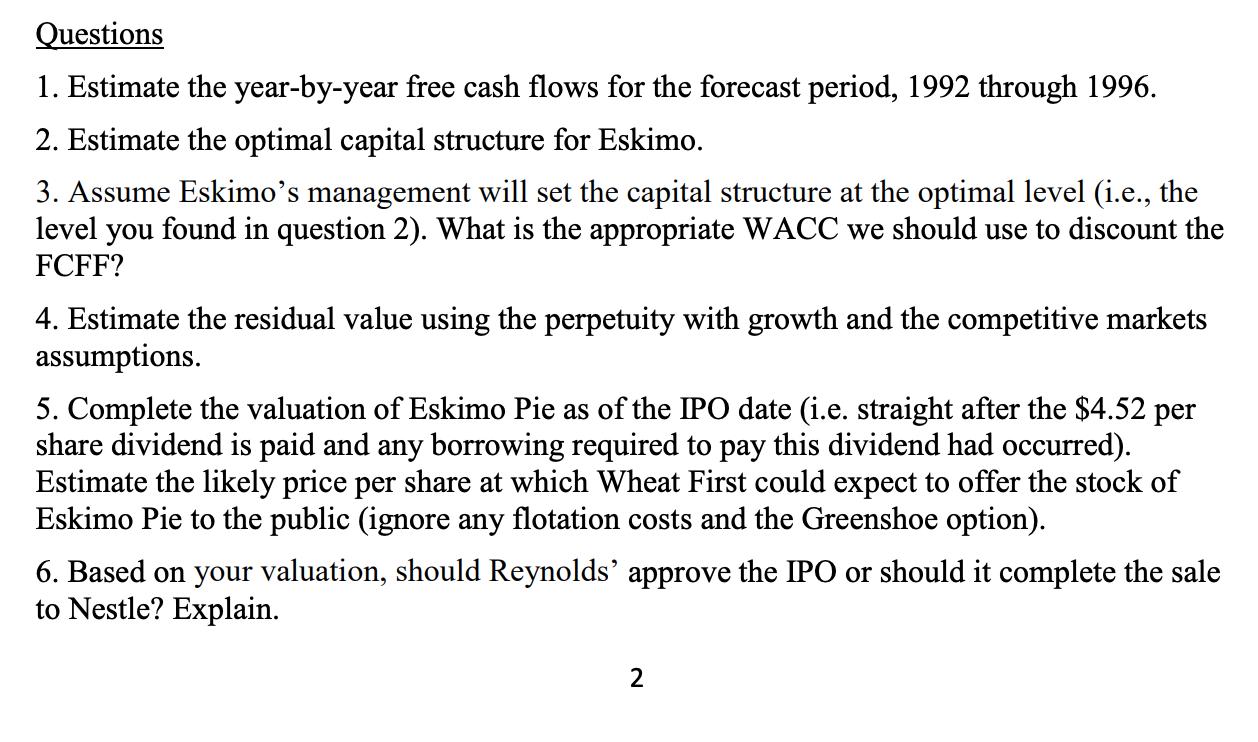
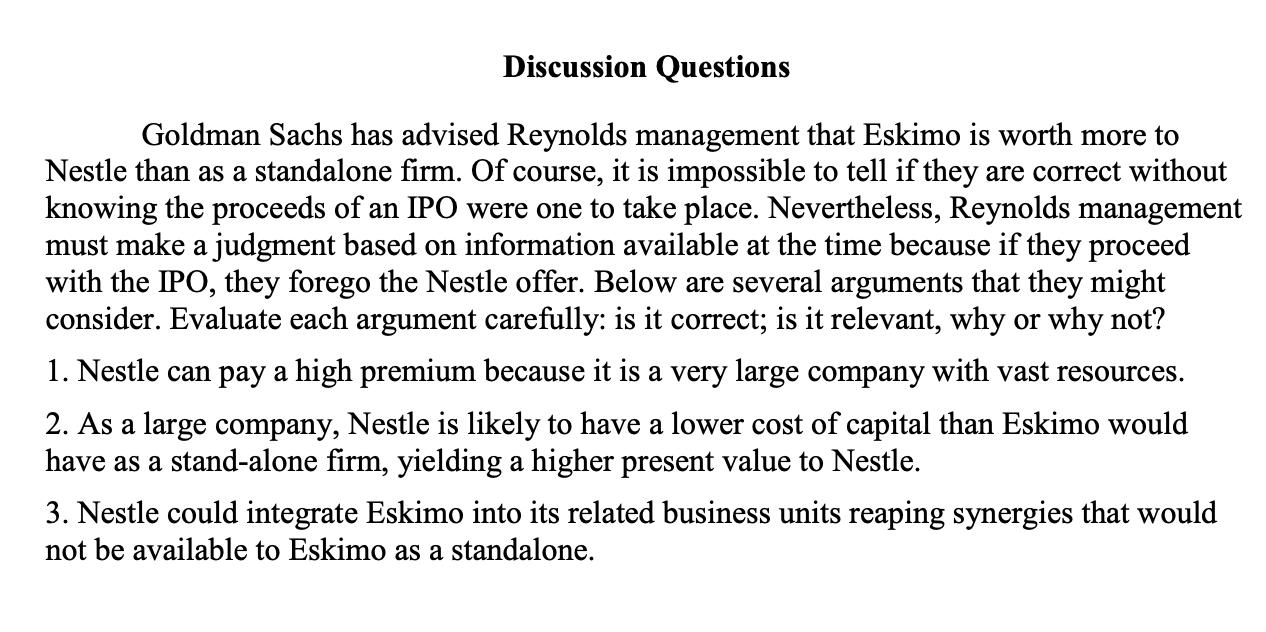
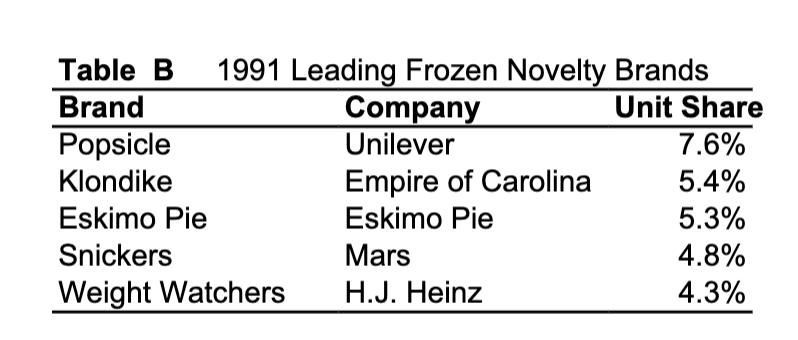
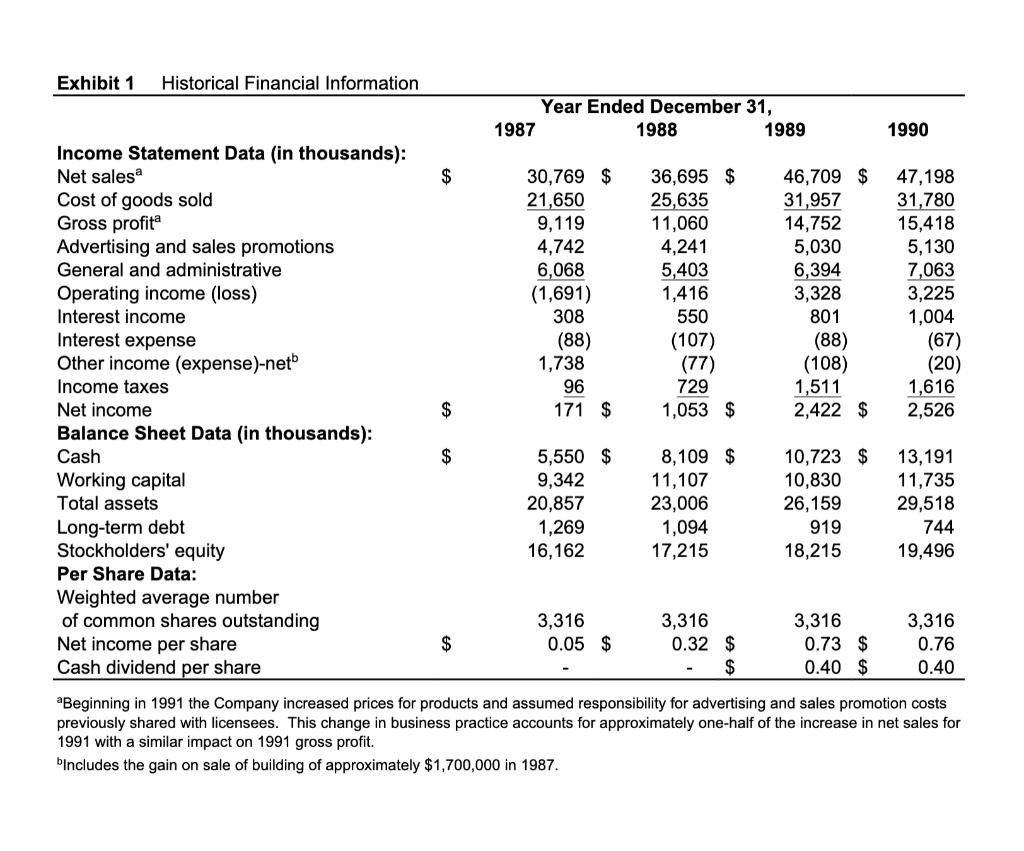
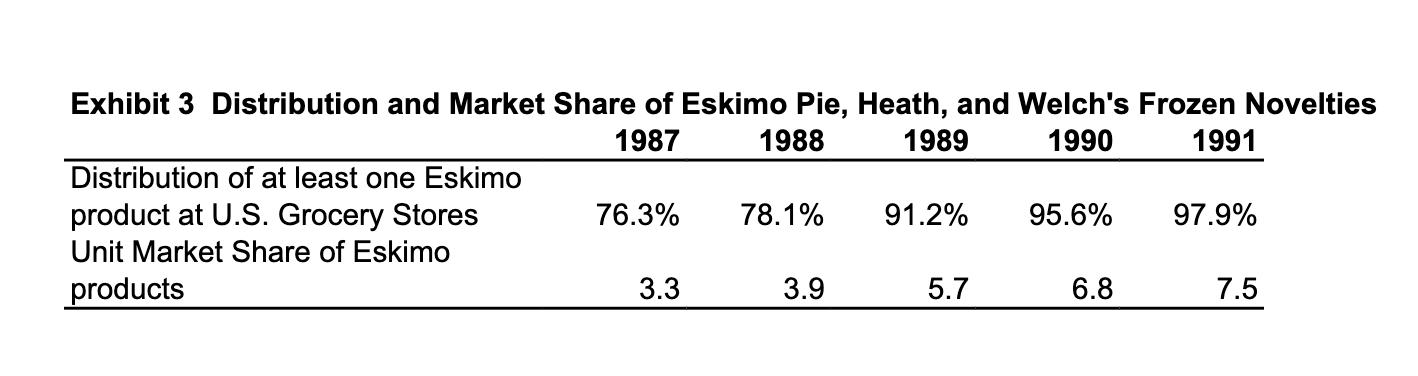
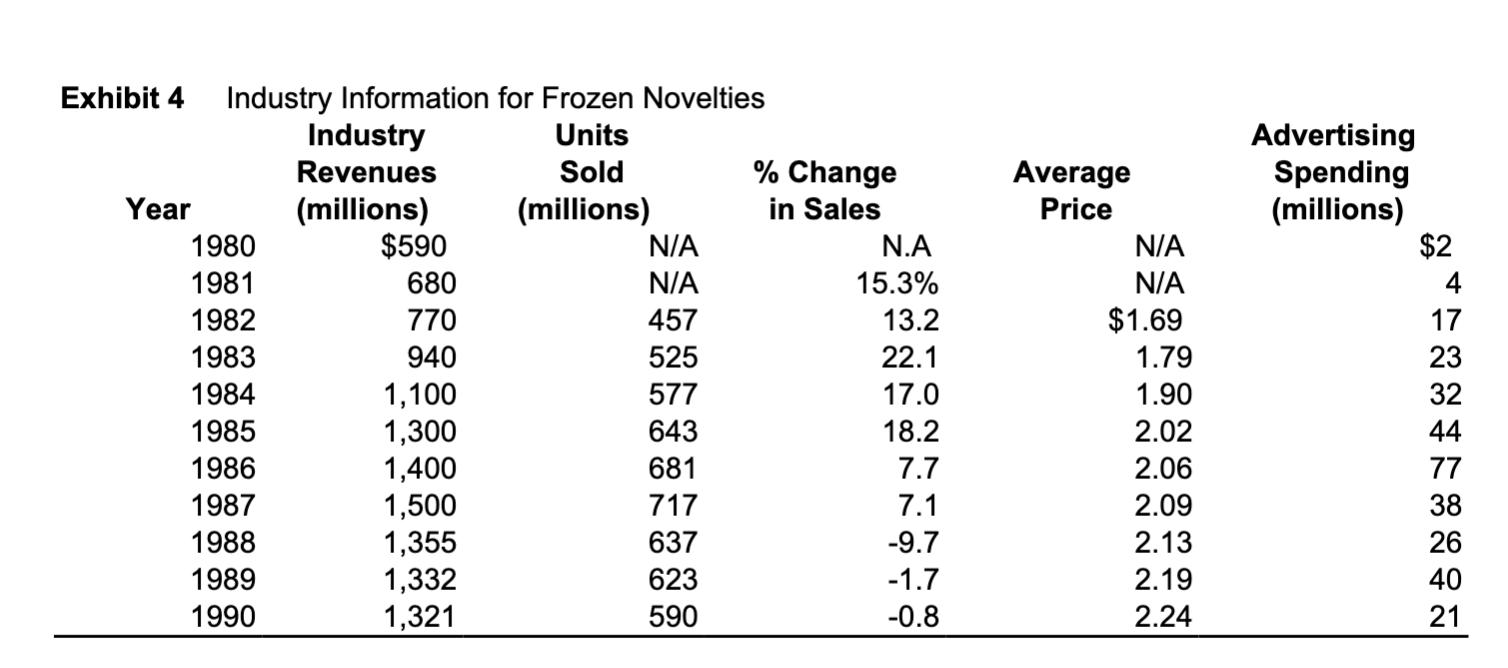
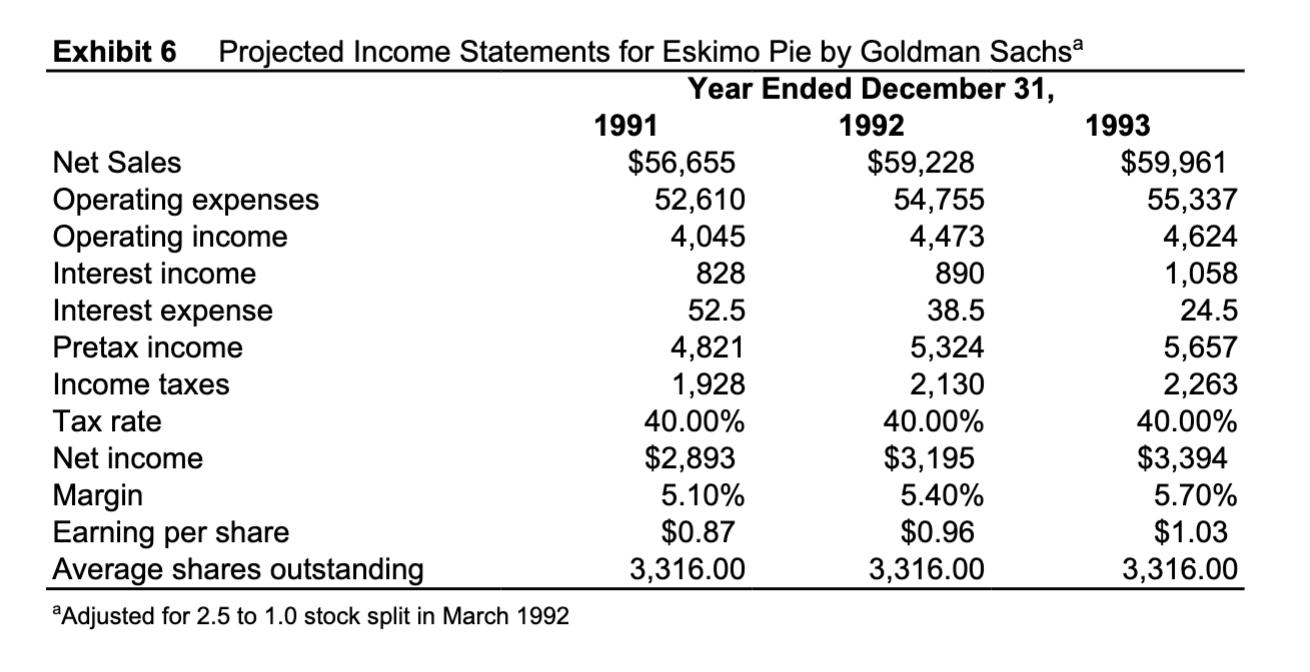
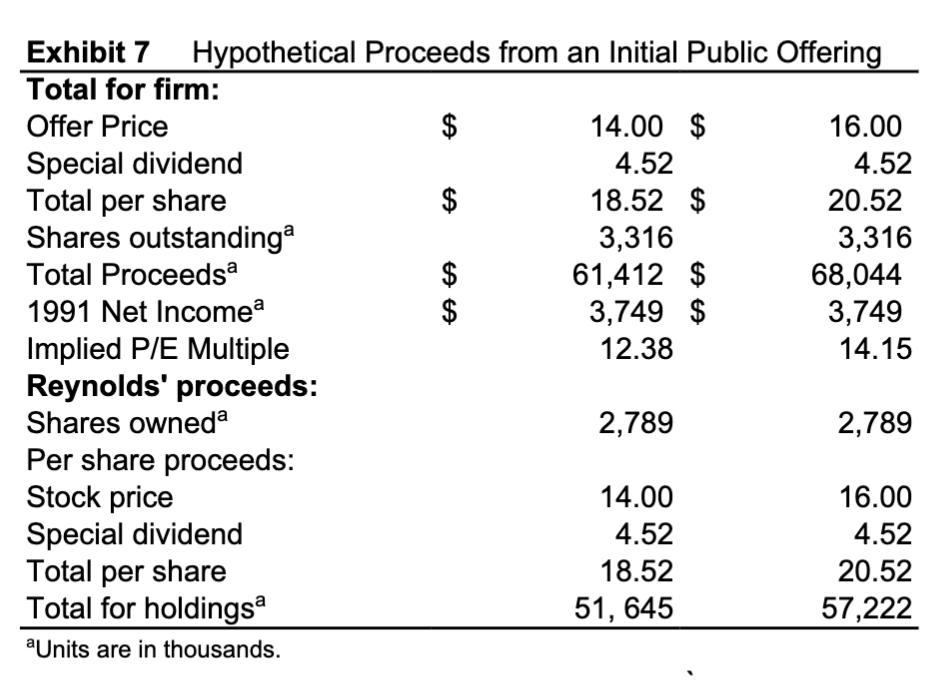
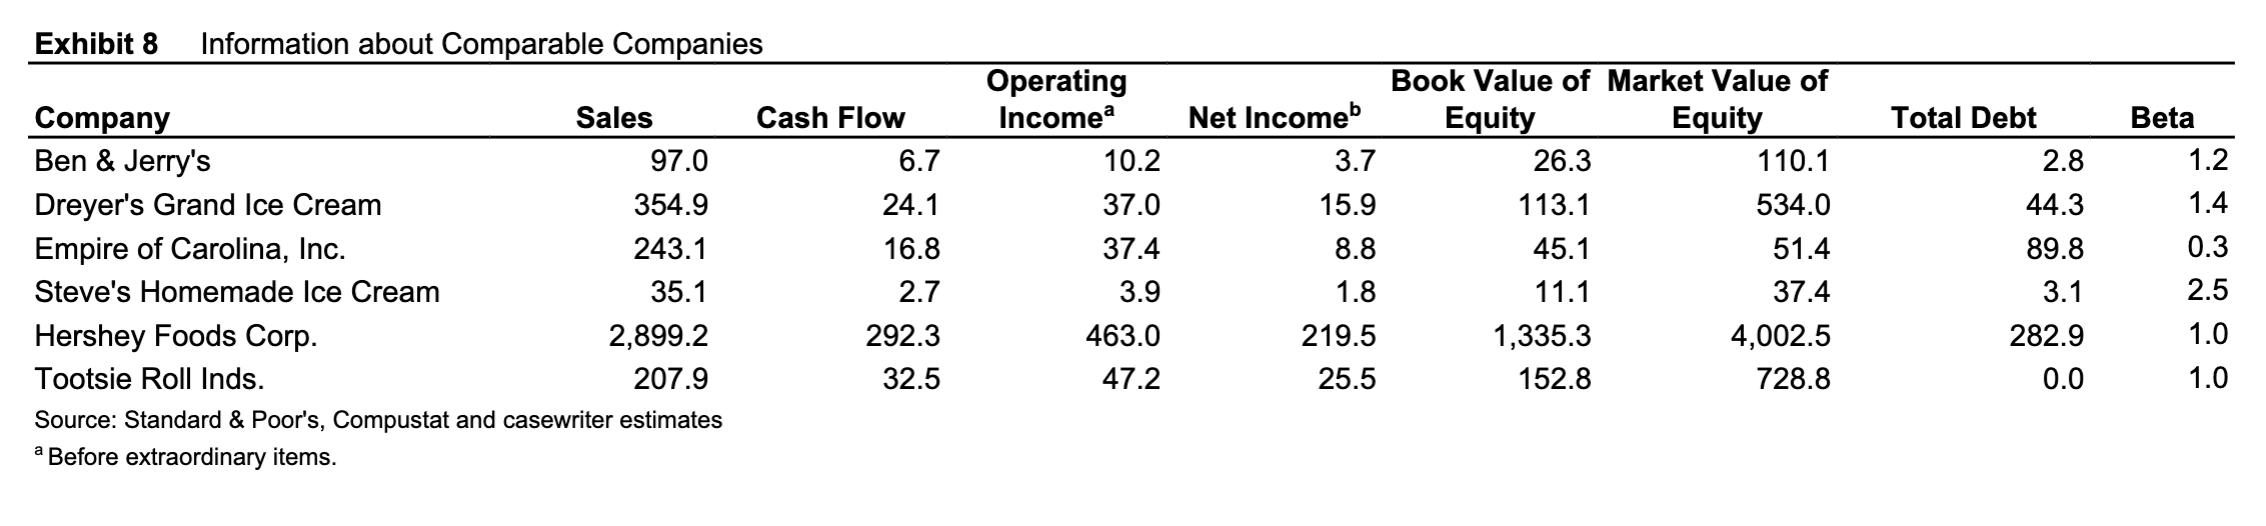
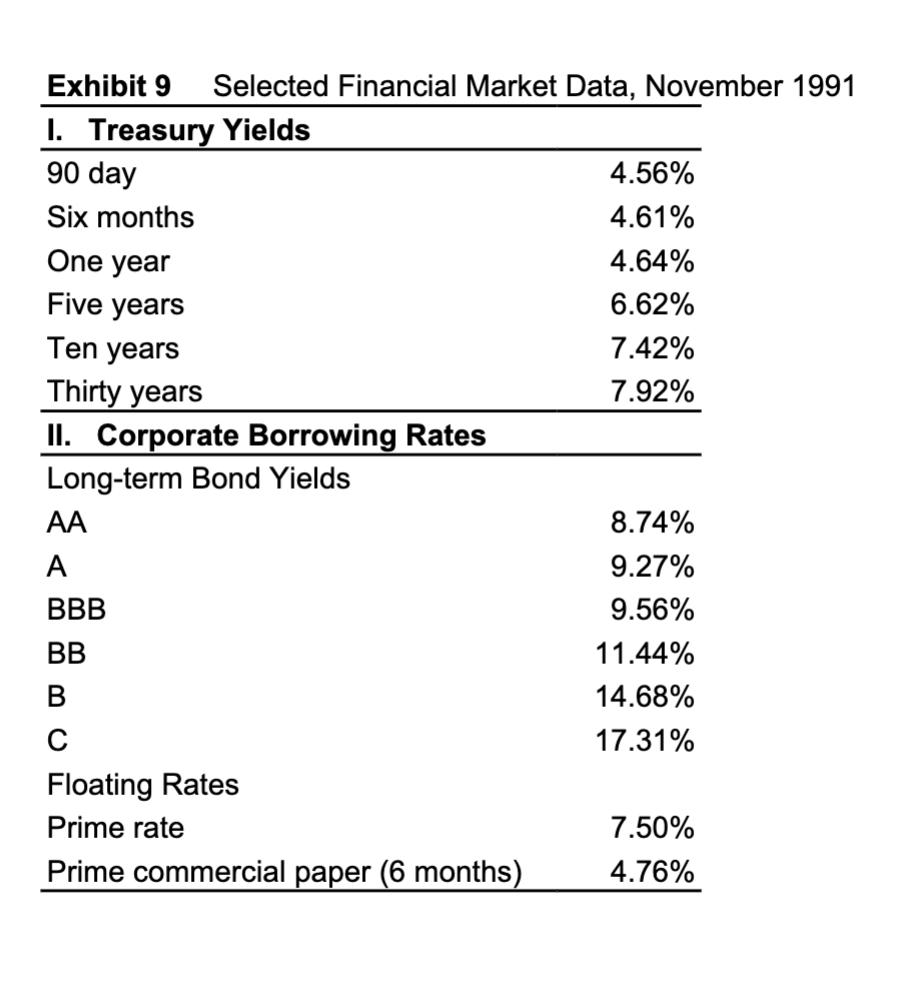
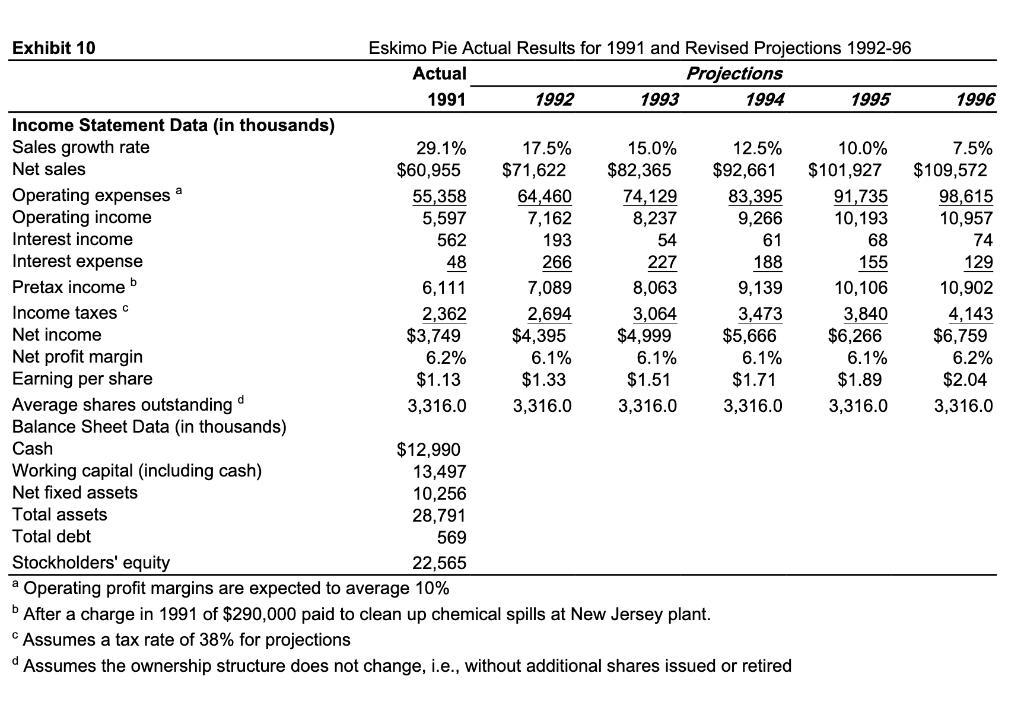
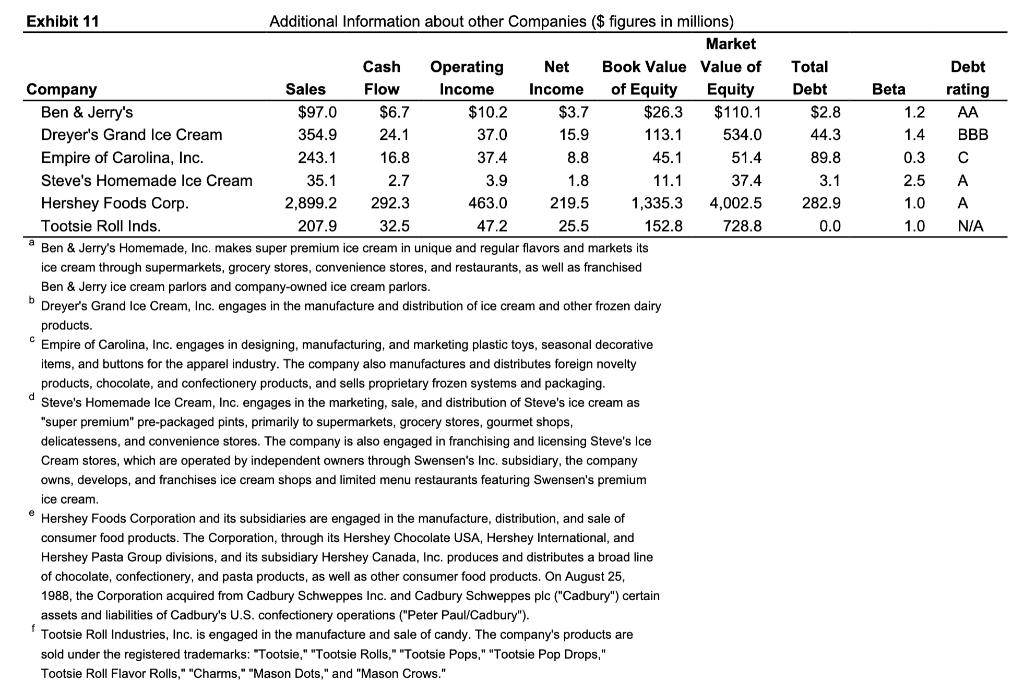
In January 1992, Eskimo Pie reported 1991 sales of $60,955,000 and net income of $3,749,000. Based on this record performance, David Clark was hopeful that he could convince Reynolds executives that an IPO of their company's shares of Eskimo Pie stock was more attractive than a sale of the company to Nestle. Reynolds executives imposed several conditions before they would entertain a revised proposal. 1. The cash dividend of $4.52 per share to existing shareholders would be paid from the excess cash balances Eskimo Pie had accumulated and from additional borrowing prior to the IPO. The new borrowing would be required in order to assure that Eskimo Pie's operating cash balances were no less than 1% of annual sales, the minimum target balance. Once the offering had been completed, Eskimo Pie management could make further changes in the capital structure to achieve whatever targets they deemed appropriate. 2. The IPO would be restricted to the sale of the shares already outstanding and would not permit the "Greenshoe Clause" which would have allowed Eskimo Pie the option to offer additional, newly created shares. Thus, the offering would be restricted to the 3,316,000 shares that were currently outstanding. Any shareholder would have the right to sell his or her shares as part of the IPO or to continue to hold those shares after the IPO when the shares could be traded in more liquid, public capital markets. Reynolds would agree to sell all of its shares as would the Reynolds Foundation, guaranteeing that at least 88% of the shares would be placed in the hands of the public. 3. Clark and the bankers from Wheat First would have to present their financial estimates to the Reynolds board who would, in turn, decide between the IPO and the sale to Nestle on the basis of which alternative would provide them with the most cash for their shares. 4. Preliminary discussions with Nestle indicated that the $61 million offer for the Eskimo Pie shares was firm despite the record profit and sales achieved in 1991. (Nestle officials claimed their own internal valuation had anticipated the improvements irrespective of the Goldman Sachs analysis.) The offer of $61 million for all Eskimo Pie shares was still on the table but would not be increased. No dividends or other distributions would be permitted prior to the closing of the sale. Assignment Assume the role of advisor to the Reynolds board. You are asked to value Eskimo Pie as a stand-alone firm as of the date of the IPO (i.e., standing at the end of 1991 valuing the estimated free cash flows starting in 1992 and onwards). Assume all cash flows occur at the end of each calendar year. Your free cash flow estimates should be based on the revised year- end results and estimates presented in Exhibit 10. (Note: Exhibits 10 and 11 have been added but are not in the original case. Exhibit 11 replicates most of Exhibit 8 and adds additional information.) Valuation Assumptions Estimated sales growth rate for 1991-1996 are provided in Exhibit 10. After 1996, assume that sales are expected to grow at 5% into the foreseeable future. • Assume that expected operating profit margin is 10%, but during adverse economic circumstances such as a recession, the firm's operating profit margin could be as low as 1% of sales. • Project necessary cash at 1% of sales. Assume that working capital requirements (including necessary cash) are 2% of sales starting in 1992. Note that the level of working capital for 1991 shown in Ex. 10 contains all cash on the balance sheet. • Net Fixed Assets (including net PP&E and related items) will grow by $250,000 between 1991 and 1992 and by the same amount between 1992 and 1993. (This number is the "net" amount over and above depreciation whereas the $1 million capital expenditure mentioned in the case is a "gross" figure). From 1993 to 1994 and onwards, Net Fixed Assets should be projected to grow in proportion to sales. Because you lack more detailed information, you must assume that the comps in Exhibit 11 do not have excess cash or other non-operating assets. • The tax rate is 38% for the projections and for all companies in Exhibit 8 and Exhibit 11. You should completely ignore Exhibit 2 in conducting your valuation. • Assume the market risk premium is 5%. Questions 1. Estimate the year-by-year free cash flows for the forecast period, 1992 through 1996. 2. Estimate the optimal capital structure for Eskimo. 3. Assume Eskimo's management will set the capital structure at the optimal level (i.e., the level you found in question 2). What is the appropriate WACC we should use to discount the FCFF? 4. Estimate the residual value using the perpetuity with growth and the competitive markets assumptions. 5. Complete the valuation of Eskimo Pie as of the IPO date (i.e. straight after the $4.52 per share dividend is paid and any borrowing required to pay this dividend had occurred). Estimate the likely price per share at which Wheat First could expect to offer the stock of Eskimo Pie to the public (ignore any flotation costs and the Greenshoe option). 6. Based on your valuation, should Reynolds' approve the IPO or should it complete the sale to Nestle? Explain. 2 Discussion Questions Goldman Sachs has advised Reynolds management that Eskimo is worth more to Nestle than as a standalone firm. Of course, it is impossible to tell if they are correct without knowing the proceeds of an IPO were one to take place. Nevertheless, Reynolds management must make a judgment based on information available at the time because if they proceed with the IPO, they forego the Nestle offer. Below are several arguments that they might consider. Evaluate each argument carefully: is it correct; is it relevant, why or why not? 1. Nestle can pay a high premium because it is a very large company with vast resources. 2. As a large company, Nestle is likely to have a lower cost of capital than Eskimo would have as a stand-alone firm, yielding higher present value to Nestle. 3. Nestle could integrate Eskimo into its related business units reaping synergies that would not be available to Eskimo as a standalone. 1991 Leading Frozen Novelty Brands Company Unilever Table B Unit Share 7.6% Brand Popsicle Klondike Empire of Carolina Eskimo Pie 5.4% 5.3% 4.8% 4.3% Eskimo Pie Snickers Mars Weight Watchers H.J. Heinz Exhibit 1 Historical Financial Information Year Ended December 31, 1987 1988 1989 1990 Income Statement Data (in thousands): Net salesa 36,695 $ 25,635 11,060 4,241 5,403 1,416 550 $ 30,769 $ 21,650 9,119 4,742 6,068 (1,691) 308 46,709 $ 31,957 14,752 5,030 6,394 3,328 801 47,198 31,780 15,418 5,130 7,063 3,225 1,004 (67) (20) 1,616 2,526 Cost of goods sold Gross profit Advertising and sales promotions General and administrative Operating income (loss) Interest income Interest expense Other income (expense)-net (88) 1,738 (107) (77) 729 (88) (108) 1,511 2,422 $ Income taxes 96 Net income 2$ 171 $ 1,053 $ Balance Sheet Data (in thousands): 8,109 $ 11,107 23,006 1,094 17,215 $ 5,550 $ 9,342 20,857 1,269 16,162 10,723 $ 10,830 26,159 Cash Working capital Total assets 13,191 11,735 29,518 Long-term debt Stockholders' equity 919 744 18,215 19,496 Per Share Data: Weighted average number of common shares outstanding Net income per share Cash dividend per share 3,316 0.32 $ 2$ 3,316 0.73 $ 0.40 $ 3,316 0.05 $ 3,316 $ 0.76 0.40 "Beginning in 1991 the Company increased prices for products and assumed responsibility for advertising and sales promotion costs previously shared with licensees. This change in business practice accounts for approximately one-half of the increase in net sales for 1991 with a similar impact on 1991 gross profit. bincludes the gain on sale of building of approximately $1,700,000 in 1987. Exhibit 3 Distribution and Market Share of Eskimo Pie, Heath, and Welch's Frozen Novelties 1987 1988 1989 1990 1991 Distribution of at least one Eskimo product at U.S. Grocery Stores 76.3% 78.1% 91.2% 95.6% 97.9% Unit Market Share of Eskimo products 3.3 3.9 5.7 6.8 7.5 Industry Information for Frozen Novelties Industry Revenues Exhibit 4 Advertising Spending (millions) $2 Units % Change in Sales Sold Average (millions) $590 (millions) N/A Year Price 1980 N.A N/A 1981 680 N/A 15.3% N/A 4 1982 770 457 13.2 $1.69 17 1983 940 525 22.1 1.79 23 1984 1.90 1,100 1,300 1,400 1,500 1,355 1,332 1,321 577 17.0 32 1985 643 18.2 2.02 44 1986 681 7.7 2.06 77 1987 717 7.1 2.09 38 1988 637 -9.7 2.13 26 1989 623 -1.7 2.19 40 1990 590 -0.8 2.24 21 Exhibit 6 Projected Income Statements for Eskimo Pie by Goldman Sachsa Year Ended December 31, 1991 1992 1993 $56,655 52,610 4,045 $59,228 54,755 4,473 890 $59,961 55,337 4,624 1,058 Net Sales Operating expenses Operating income Interest income 828 Interest expense 52.5 38.5 24.5 4,821 1,928 40.00% 5,324 2,130 40.00% 5,657 2,263 40.00% Pretax income Income taxes Tax rate Net income $2,893 $3,195 $3,394 Margin Earning per share Average shares outstanding 5.10% 5.40% 5.70% $0.96 3,316.00 $0.87 $1.03 3,316.00 3,316.00 "Adjusted for 2.5 to 1.0 stock split in March 1992 Exhibit 7 Hypothetical Proceeds from an Initial Public Offering Total for firm: Offer Price 14.00 $ 16.00 Special dividend Total per share Shares outstandinga 4.52 4.52 18.52 $ 20.52 3,316 61,412 $ 3,749 $ 3,316 68,044 3,749 Total Proceedsa 1991 Net Incomea Implied P/E Multiple Reynolds' proceeds: Shares owneda Per share proceeds: Stock price Special dividend Total per share Total for holdingsa 12.38 14.15 2,789 2,789 14.00 16.00 4.52 4.52 18.52 20.52 51, 645 57,222 aUnits are in thousands. %24 %24 Exhibit 8 Information about Comparable Companies Operating Incomea Book Value of Market Value of Net Incomeb Equity Company Ben & Jerry's Sales Cash Flow Equity Total Debt Beta 97.0 6.7 10.2 3.7 26.3 110.1 2.8 1.2 Dreyer's Grand Ice Cream 354.9 24.1 37.0 15.9 113.1 534.0 44.3 1.4 Empire of Carolina, Inc. 243.1 16.8 37.4 8.8 45.1 51.4 89.8 0.3 Steve's Homemade Ice Cream 35.1 2.7 3.9 1.8 11.1 37.4 3.1 2.5 Hershey Foods Corp. 2,899.2 292.3 463.0 219.5 1,335.3 4,002.5 282.9 1.0 Tootsie Roll Inds. 207.9 32.5 47.2 25.5 152.8 728.8 0.0 1.0 Source: Standard & Poor's, Compustat and casewriter estimates a Before extraordinary items. Exhibit 9 Selected Financial Market Data, November 1991 I. Treasury Yields 90 day 4.56% Six months 4.61% One year 4.64% Five years 6.62% Ten years 7.42% Thirty years II. Corporate Borrowing Rates Long-term Bond Yields 7.92% AA 8.74% A 9.27% BBB 9.56% BB 11.44% В 14.68% C 17.31% Floating Rates Prime rate 7.50% Prime commercial paper (6 months) 4.76% Exhibit 10 Eskimo Pie Actual Results for 1991 and Revised Projections 1992-96 Actual Projections 1991 1992 1993 1994 1995 1996 Income Statement Data (in thousands) Sales growth rate 29.1% 17.5% 15.0% 12.5% 10.0% 7.5% Net sales $60,955 $71,622 $82,365 $92,661 $101,927 $109,572 a Operating expenses Operating income Interest income 55,358 5,597 64,460 7,162 193 74,129 8,237 83,395 9,266 91,735 10,193 68 98,615 10,957 562 54 61 74 Interest expense 48 266 227 188 155 129 Pretax income b 6,111 7,089 8,063 9,139 10,106 10,902 Income taxes ° 2,362 $3,749 2,694 $4,395 3,064 $4,999 6.1% $1.51 4,143 $6,759 6.2% 3,473 $5,666 3,840 $6,266 Net income Net profit margin Earning per share 6.2% 6.1% 6.1% 6.1% $1.13 $1.33 $1.71 $1.89 $2.04 Average shares outstanding Balance Sheet Data (in thousands) 3,316.0 3,316.0 3,316.0 3,316.0 3,316.0 3,316.0 Cash $12,990 13,497 10,256 28,791 Working capital (including cash) Net fixed assets Total assets Total debt 569 Stockholders' equity 22,565 a Operating profit margins are expected to average 10% b After a charge in 1991 of $290,000 paid to clean up chemical spills at New Jersey plant. C Assumes a tax rate of 38% for projections d Assumes the ownership structure does not change, i.e., without additional shares issued or retired Exhibit 11 Additional Information about other Companies ($ figures in millions) Market Cash Operating Net Book Value Value of Total Debt of Equity $26.3 Company Sales Flow Income Income Equity Debt Beta rating $2.8 Ben & Jerry's Dreyer's Grand Ice Cream $97.0 $6.7 $10.2 $3.7 $110.1 1.2 AA 354.9 24.1 37.0 15.9 113.1 534.0 44.3 1.4 BBB Empire of Carolina, Inc. 243.1 16.8 37.4 8.8 45.1 51.4 89.8 0.3 Steve's Homemade Ice Cream 35.1 2.7 3.9 1.8 11.1 37.4 3.1 2.5 A Hershey Foods Corp. 2,899.2 292.3 463.0 219.5 1,335.3 4,002.5 282.9 1.0 A Tootsie Roll Inds. 207.9 32.5 47.2 25.5 152.8 728.8 0.0 1.0 N/A * Ben & Jerry's Homemade, Inc. makes super premium ice cream in unique and regular flavors and markets its ice cream through supermarkets, grocery stores, convenience stores, and restaurants, as well as franchised Ben & Jerry ice cream parlors and company-owned ice cream parlors. " Dreyer's Grand Ice Cream, Inc. engages in the manufacture and distribution of ice cream and other frozen dairy products. C Empire of Carolina, Inc. engages in designing, manufacturing, and marketing plastic toys, seasonal decorative items, and buttons for the apparel industry. The company also manufactures and distributes foreign novelty products, chocolate, and confectionery products, and sells proprietary frozen systems and packaging. Steve's Homemade Ice Cream, Inc. engages in the marketing, sale, and distribution of Steve's ice cream as "super premium" pre-packaged pints, primarily to supermarkets, grocery stores, gourmet shops, delicatessens, and convenience stores. The company is also engaged in franchising and licensing Steve's Ice Cream stores, which are operated by independent owners through Swensen's Inc. subsidiary, the mpar owns, develops, and franchises ice cream shops and limited menu restaurants featuring Swensen's premium ice cream. e Hershey Foods Corporation and its subsidiaries are engaged in the manufacture, distribution, and sale of consumer food products. The Corporation, through its Hershey Chocolate USA, Hershey International, and Hershey Pasta Group divisions, and its subsidiary Hershey Canada, Inc. produces and distributes a broad line of chocolate, confectionery, and pasta products, as well as other consumer food products. On August 25, 1988, the Corporation acquired from Cadbury Schweppes Inc. and Cadbury Schweppes plc ("Cadbury") certain assets and liabilities of Cadbury's U.S. confectionery operations ("Peter Paul/Cadbury"). Tootsie Roll Industries, Inc. is engaged in the manufacture and sale of candy. The company's products are sold under the registered trademarks: "Tootsie," "Tootsie Rolls," "Tootsie Pops," "Tootsie Pop Drops," Tootsie Roll Flavor Rolls," "Charms," "Mason Dots," and "Mason Crows." In January 1992, Eskimo Pie reported 1991 sales of $60,955,000 and net income of $3,749,000. Based on this record performance, David Clark was hopeful that he could convince Reynolds executives that an IPO of their company's shares of Eskimo Pie stock was more attractive than a sale of the company to Nestle. Reynolds executives imposed several conditions before they would entertain a revised proposal. 1. The cash dividend of $4.52 per share to existing shareholders would be paid from the excess cash balances Eskimo Pie had accumulated and from additional borrowing prior to the IPO. The new borrowing would be required in order to assure that Eskimo Pie's operating cash balances were no less than 1% of annual sales, the minimum target balance. Once the offering had been completed, Eskimo Pie management could make further changes in the capital structure to achieve whatever targets they deemed appropriate. 2. The IPO would be restricted to the sale of the shares already outstanding and would not permit the "Greenshoe Clause" which would have allowed Eskimo Pie the option to offer additional, newly created shares. Thus, the offering would be restricted to the 3,316,000 shares that were currently outstanding. Any shareholder would have the right to sell his or her shares as part of the IPO or to continue to hold those shares after the IPO when the shares could be traded in more liquid, public capital markets. Reynolds would agree to sell all of its shares as would the Reynolds Foundation, guaranteeing that at least 88% of the shares would be placed in the hands of the public. 3. Clark and the bankers from Wheat First would have to present their financial estimates to the Reynolds board who would, in turn, decide between the IPO and the sale to Nestle on the basis of which alternative would provide them with the most cash for their shares. 4. Preliminary discussions with Nestle indicated that the $61 million offer for the Eskimo Pie shares was firm despite the record profit and sales achieved in 1991. (Nestle officials claimed their own internal valuation had anticipated the improvements irrespective of the Goldman Sachs analysis.) The offer of $61 million for all Eskimo Pie shares was still on the table but would not be increased. No dividends or other distributions would be permitted prior to the closing of the sale. Assignment Assume the role of advisor to the Reynolds board. You are asked to value Eskimo Pie as a stand-alone firm as of the date of the IPO (i.e., standing at the end of 1991 valuing the estimated free cash flows starting in 1992 and onwards). Assume all cash flows occur at the end of each calendar year. Your free cash flow estimates should be based on the revised year- end results and estimates presented in Exhibit 10. (Note: Exhibits 10 and 11 have been added but are not in the original case. Exhibit 11 replicates most of Exhibit 8 and adds additional information.) Valuation Assumptions Estimated sales growth rate for 1991-1996 are provided in Exhibit 10. After 1996, assume that sales are expected to grow at 5% into the foreseeable future. • Assume that expected operating profit margin is 10%, but during adverse economic circumstances such as a recession, the firm's operating profit margin could be as low as 1% of sales. • Project necessary cash at 1% of sales. Assume that working capital requirements (including necessary cash) are 2% of sales starting in 1992. Note that the level of working capital for 1991 shown in Ex. 10 contains all cash on the balance sheet. • Net Fixed Assets (including net PP&E and related items) will grow by $250,000 between 1991 and 1992 and by the same amount between 1992 and 1993. (This number is the "net" amount over and above depreciation whereas the $1 million capital expenditure mentioned in the case is a "gross" figure). From 1993 to 1994 and onwards, Net Fixed Assets should be projected to grow in proportion to sales. Because you lack more detailed information, you must assume that the comps in Exhibit 11 do not have excess cash or other non-operating assets. • The tax rate is 38% for the projections and for all companies in Exhibit 8 and Exhibit 11. You should completely ignore Exhibit 2 in conducting your valuation. • Assume the market risk premium is 5%. Questions 1. Estimate the year-by-year free cash flows for the forecast period, 1992 through 1996. 2. Estimate the optimal capital structure for Eskimo. 3. Assume Eskimo's management will set the capital structure at the optimal level (i.e., the level you found in question 2). What is the appropriate WACC we should use to discount the FCFF? 4. Estimate the residual value using the perpetuity with growth and the competitive markets assumptions. 5. Complete the valuation of Eskimo Pie as of the IPO date (i.e. straight after the $4.52 per share dividend is paid and any borrowing required to pay this dividend had occurred). Estimate the likely price per share at which Wheat First could expect to offer the stock of Eskimo Pie to the public (ignore any flotation costs and the Greenshoe option). 6. Based on your valuation, should Reynolds' approve the IPO or should it complete the sale to Nestle? Explain. 2 Discussion Questions Goldman Sachs has advised Reynolds management that Eskimo is worth more to Nestle than as a standalone firm. Of course, it is impossible to tell if they are correct without knowing the proceeds of an IPO were one to take place. Nevertheless, Reynolds management must make a judgment based on information available at the time because if they proceed with the IPO, they forego the Nestle offer. Below are several arguments that they might consider. Evaluate each argument carefully: is it correct; is it relevant, why or why not? 1. Nestle can pay a high premium because it is a very large company with vast resources. 2. As a large company, Nestle is likely to have a lower cost of capital than Eskimo would have as a stand-alone firm, yielding higher present value to Nestle. 3. Nestle could integrate Eskimo into its related business units reaping synergies that would not be available to Eskimo as a standalone. 1991 Leading Frozen Novelty Brands Company Unilever Table B Unit Share 7.6% Brand Popsicle Klondike Empire of Carolina Eskimo Pie 5.4% 5.3% 4.8% 4.3% Eskimo Pie Snickers Mars Weight Watchers H.J. Heinz Exhibit 1 Historical Financial Information Year Ended December 31, 1987 1988 1989 1990 Income Statement Data (in thousands): Net salesa 36,695 $ 25,635 11,060 4,241 5,403 1,416 550 $ 30,769 $ 21,650 9,119 4,742 6,068 (1,691) 308 46,709 $ 31,957 14,752 5,030 6,394 3,328 801 47,198 31,780 15,418 5,130 7,063 3,225 1,004 (67) (20) 1,616 2,526 Cost of goods sold Gross profit Advertising and sales promotions General and administrative Operating income (loss) Interest income Interest expense Other income (expense)-net (88) 1,738 (107) (77) 729 (88) (108) 1,511 2,422 $ Income taxes 96 Net income 2$ 171 $ 1,053 $ Balance Sheet Data (in thousands): 8,109 $ 11,107 23,006 1,094 17,215 $ 5,550 $ 9,342 20,857 1,269 16,162 10,723 $ 10,830 26,159 Cash Working capital Total assets 13,191 11,735 29,518 Long-term debt Stockholders' equity 919 744 18,215 19,496 Per Share Data: Weighted average number of common shares outstanding Net income per share Cash dividend per share 3,316 0.32 $ 2$ 3,316 0.73 $ 0.40 $ 3,316 0.05 $ 3,316 $ 0.76 0.40 "Beginning in 1991 the Company increased prices for products and assumed responsibility for advertising and sales promotion costs previously shared with licensees. This change in business practice accounts for approximately one-half of the increase in net sales for 1991 with a similar impact on 1991 gross profit. bincludes the gain on sale of building of approximately $1,700,000 in 1987. Exhibit 3 Distribution and Market Share of Eskimo Pie, Heath, and Welch's Frozen Novelties 1987 1988 1989 1990 1991 Distribution of at least one Eskimo product at U.S. Grocery Stores 76.3% 78.1% 91.2% 95.6% 97.9% Unit Market Share of Eskimo products 3.3 3.9 5.7 6.8 7.5 Industry Information for Frozen Novelties Industry Revenues Exhibit 4 Advertising Spending (millions) $2 Units % Change in Sales Sold Average (millions) $590 (millions) N/A Year Price 1980 N.A N/A 1981 680 N/A 15.3% N/A 4 1982 770 457 13.2 $1.69 17 1983 940 525 22.1 1.79 23 1984 1.90 1,100 1,300 1,400 1,500 1,355 1,332 1,321 577 17.0 32 1985 643 18.2 2.02 44 1986 681 7.7 2.06 77 1987 717 7.1 2.09 38 1988 637 -9.7 2.13 26 1989 623 -1.7 2.19 40 1990 590 -0.8 2.24 21 Exhibit 6 Projected Income Statements for Eskimo Pie by Goldman Sachsa Year Ended December 31, 1991 1992 1993 $56,655 52,610 4,045 $59,228 54,755 4,473 890 $59,961 55,337 4,624 1,058 Net Sales Operating expenses Operating income Interest income 828 Interest expense 52.5 38.5 24.5 4,821 1,928 40.00% 5,324 2,130 40.00% 5,657 2,263 40.00% Pretax income Income taxes Tax rate Net income $2,893 $3,195 $3,394 Margin Earning per share Average shares outstanding 5.10% 5.40% 5.70% $0.96 3,316.00 $0.87 $1.03 3,316.00 3,316.00 "Adjusted for 2.5 to 1.0 stock split in March 1992 Exhibit 7 Hypothetical Proceeds from an Initial Public Offering Total for firm: Offer Price 14.00 $ 16.00 Special dividend Total per share Shares outstandinga 4.52 4.52 18.52 $ 20.52 3,316 61,412 $ 3,749 $ 3,316 68,044 3,749 Total Proceedsa 1991 Net Incomea Implied P/E Multiple Reynolds' proceeds: Shares owneda Per share proceeds: Stock price Special dividend Total per share Total for holdingsa 12.38 14.15 2,789 2,789 14.00 16.00 4.52 4.52 18.52 20.52 51, 645 57,222 aUnits are in thousands. %24 %24 Exhibit 8 Information about Comparable Companies Operating Incomea Book Value of Market Value of Net Incomeb Equity Company Ben & Jerry's Sales Cash Flow Equity Total Debt Beta 97.0 6.7 10.2 3.7 26.3 110.1 2.8 1.2 Dreyer's Grand Ice Cream 354.9 24.1 37.0 15.9 113.1 534.0 44.3 1.4 Empire of Carolina, Inc. 243.1 16.8 37.4 8.8 45.1 51.4 89.8 0.3 Steve's Homemade Ice Cream 35.1 2.7 3.9 1.8 11.1 37.4 3.1 2.5 Hershey Foods Corp. 2,899.2 292.3 463.0 219.5 1,335.3 4,002.5 282.9 1.0 Tootsie Roll Inds. 207.9 32.5 47.2 25.5 152.8 728.8 0.0 1.0 Source: Standard & Poor's, Compustat and casewriter estimates a Before extraordinary items. Exhibit 9 Selected Financial Market Data, November 1991 I. Treasury Yields 90 day 4.56% Six months 4.61% One year 4.64% Five years 6.62% Ten years 7.42% Thirty years II. Corporate Borrowing Rates Long-term Bond Yields 7.92% AA 8.74% A 9.27% BBB 9.56% BB 11.44% В 14.68% C 17.31% Floating Rates Prime rate 7.50% Prime commercial paper (6 months) 4.76% Exhibit 10 Eskimo Pie Actual Results for 1991 and Revised Projections 1992-96 Actual Projections 1991 1992 1993 1994 1995 1996 Income Statement Data (in thousands) Sales growth rate 29.1% 17.5% 15.0% 12.5% 10.0% 7.5% Net sales $60,955 $71,622 $82,365 $92,661 $101,927 $109,572 a Operating expenses Operating income Interest income 55,358 5,597 64,460 7,162 193 74,129 8,237 83,395 9,266 91,735 10,193 68 98,615 10,957 562 54 61 74 Interest expense 48 266 227 188 155 129 Pretax income b 6,111 7,089 8,063 9,139 10,106 10,902 Income taxes ° 2,362 $3,749 2,694 $4,395 3,064 $4,999 6.1% $1.51 4,143 $6,759 6.2% 3,473 $5,666 3,840 $6,266 Net income Net profit margin Earning per share 6.2% 6.1% 6.1% 6.1% $1.13 $1.33 $1.71 $1.89 $2.04 Average shares outstanding Balance Sheet Data (in thousands) 3,316.0 3,316.0 3,316.0 3,316.0 3,316.0 3,316.0 Cash $12,990 13,497 10,256 28,791 Working capital (including cash) Net fixed assets Total assets Total debt 569 Stockholders' equity 22,565 a Operating profit margins are expected to average 10% b After a charge in 1991 of $290,000 paid to clean up chemical spills at New Jersey plant. C Assumes a tax rate of 38% for projections d Assumes the ownership structure does not change, i.e., without additional shares issued or retired Exhibit 11 Additional Information about other Companies ($ figures in millions) Market Cash Operating Net Book Value Value of Total Debt of Equity $26.3 Company Sales Flow Income Income Equity Debt Beta rating $2.8 Ben & Jerry's Dreyer's Grand Ice Cream $97.0 $6.7 $10.2 $3.7 $110.1 1.2 AA 354.9 24.1 37.0 15.9 113.1 534.0 44.3 1.4 BBB Empire of Carolina, Inc. 243.1 16.8 37.4 8.8 45.1 51.4 89.8 0.3 Steve's Homemade Ice Cream 35.1 2.7 3.9 1.8 11.1 37.4 3.1 2.5 A Hershey Foods Corp. 2,899.2 292.3 463.0 219.5 1,335.3 4,002.5 282.9 1.0 A Tootsie Roll Inds. 207.9 32.5 47.2 25.5 152.8 728.8 0.0 1.0 N/A * Ben & Jerry's Homemade, Inc. makes super premium ice cream in unique and regular flavors and markets its ice cream through supermarkets, grocery stores, convenience stores, and restaurants, as well as franchised Ben & Jerry ice cream parlors and company-owned ice cream parlors. " Dreyer's Grand Ice Cream, Inc. engages in the manufacture and distribution of ice cream and other frozen dairy products. C Empire of Carolina, Inc. engages in designing, manufacturing, and marketing plastic toys, seasonal decorative items, and buttons for the apparel industry. The company also manufactures and distributes foreign novelty products, chocolate, and confectionery products, and sells proprietary frozen systems and packaging. Steve's Homemade Ice Cream, Inc. engages in the marketing, sale, and distribution of Steve's ice cream as "super premium" pre-packaged pints, primarily to supermarkets, grocery stores, gourmet shops, delicatessens, and convenience stores. The company is also engaged in franchising and licensing Steve's Ice Cream stores, which are operated by independent owners through Swensen's Inc. subsidiary, the mpar owns, develops, and franchises ice cream shops and limited menu restaurants featuring Swensen's premium ice cream. e Hershey Foods Corporation and its subsidiaries are engaged in the manufacture, distribution, and sale of consumer food products. The Corporation, through its Hershey Chocolate USA, Hershey International, and Hershey Pasta Group divisions, and its subsidiary Hershey Canada, Inc. produces and distributes a broad line of chocolate, confectionery, and pasta products, as well as other consumer food products. On August 25, 1988, the Corporation acquired from Cadbury Schweppes Inc. and Cadbury Schweppes plc ("Cadbury") certain assets and liabilities of Cadbury's U.S. confectionery operations ("Peter Paul/Cadbury"). Tootsie Roll Industries, Inc. is engaged in the manufacture and sale of candy. The company's products are sold under the registered trademarks: "Tootsie," "Tootsie Rolls," "Tootsie Pops," "Tootsie Pop Drops," Tootsie Roll Flavor Rolls," "Charms," "Mason Dots," and "Mason Crows."
Expert Answer:
Answer rating: 100% (QA)
1 1992 EBITDA 4749000 Interest Expense 0 Depreciation Amortization 500000 Capital Expenditures 600000 Taxes 1000000 Free Cash Flow 2649000 1993 EBITDA 5249000 Interest Expense 0 Depreciation Amortizat... View the full answer

Related Book For 
Posted Date:
Students also viewed these accounting questions
-
You are forecasting incremental free cash flows for Daily Enterprises. Based on the information in Problems 1 and 2, what are the incremental free cash flows associated with the new machine?
-
The chapter describes free cash flows for common equity shareholders. If the firm borrows cash by issuing debt, how does that transaction affect free cash flows for common equity shareholders in that...
-
The chapter describes free cash flows for common equity shareholders. Suppose a firm has no debt and uses marketable securities to manage operating liquidity. If the firm uses cash to purchase...
-
Solve the linear equation with the x-intercept method. Check your answer. Approximate the solution to the nearest thousandth whenever appropriate. 2x = -(3x)
-
Write the balanced chemical equation for the neutralization reaction between HCl and Mg(OH)2. What is the name of the salt that is formed?
-
What is the total of current assets? A. 220m. B. 250m. C. 290m. D. 270m. E. 570m. Using the following balance sheet and income statement Balance sheet m Property 200 Trade payables Plant and...
-
For a specific paint application, a mixture of solvents is needed. The mixture will be identified by its ability to mix with water (total miscibility), its normal boiling point (determines the...
-
Marys Ice Cream Shoppe sold 9,100 servings of ice cream during June for $4 per serving. Mary purchases the ice cream in large tubs from the Organic Ice Cream Company. Each tub costs Mary $14 and has...
-
Based on the textbook "Abnormal Psychology" by Gelzfeld, second edition, define abnormal psychology.
-
A manufacturer of prefabricated homes has decided to subcontract four components of the homes. Several companies are interested in receiving this business, but none can handle more than one...
-
Ecosystem services, the benefits humans derive from nature, are a critical to the raising of awareness of the value of nature. Discuss
-
It exports fifty 120-passenger jets to regional airlines primarily in the United States and Western Europe. Sales contracts are US$ denominated and average $100 million per plane. Its book of future...
-
Royal Dutch Shellthe Anglo-Dutch oil company issues a dollar-denominated seven-year zero-coupon Eurobond in the amount of US$1 billion at an annual yield of 6. 5 percent. a. Where would the funds...
-
How do host countries gauge the costs and benefits of foreign direct investments over the life of a project? Why should foreign direct investors understand how such analysis is carried out and the...
-
On August 28, 2010, IBM International Finance NVthe Dutch Antillesbased international finance subsidiary of IBM Corporationissued four $100 million equivalent tranches of Eurobonds respectively...
-
Nokiathe Finnish manufacturer of cell phonesis considering alternative financing options to fund the $1 billion acquisition of U.S.-based Magic Telecommunications. A -denominated Eurobond at an...
-
Write a C program that declares and initialize a 5X5 array. Then the program copies to another 1D arrays, any value which has odd sum of digits. Use the following in your program. ROWS: 5 COLS: 5 int...
-
The MIT Sloan School of Management is one of the leading business schools in the U.S. The following table contains the tuition data for the masters program in the Sloan School of Management. a. Use...
-
How are FICO scores used in classifying loans?
-
What are the advantages of an exchange-traded fund relative to open-end and closed-end investment companies?
-
Why is it important to look at the dispersion of property types and geographical location of properties in analyzing a CMBS transaction?
-
The hydrodynamic boundary layer equations consist of one momentum equation and the continuity equation. How does one solve for the pressure?
-
In laminar flow, why does the heat transfer coefficient decrease as the boundary layer thickness grows?
-
How does the hydrodynamic boundary layer thickness depend upon the Reynolds number?

Study smarter with the SolutionInn App