

Question: 2. The impact of a tariff Consider a hypothetical example of trade in aluminum between the United States and China. For simplicity, assume that
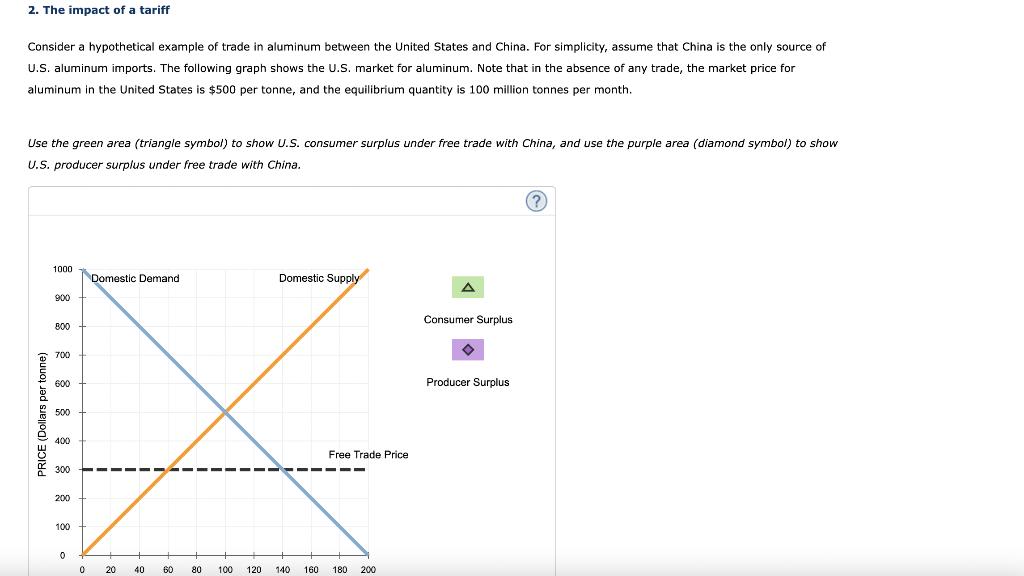

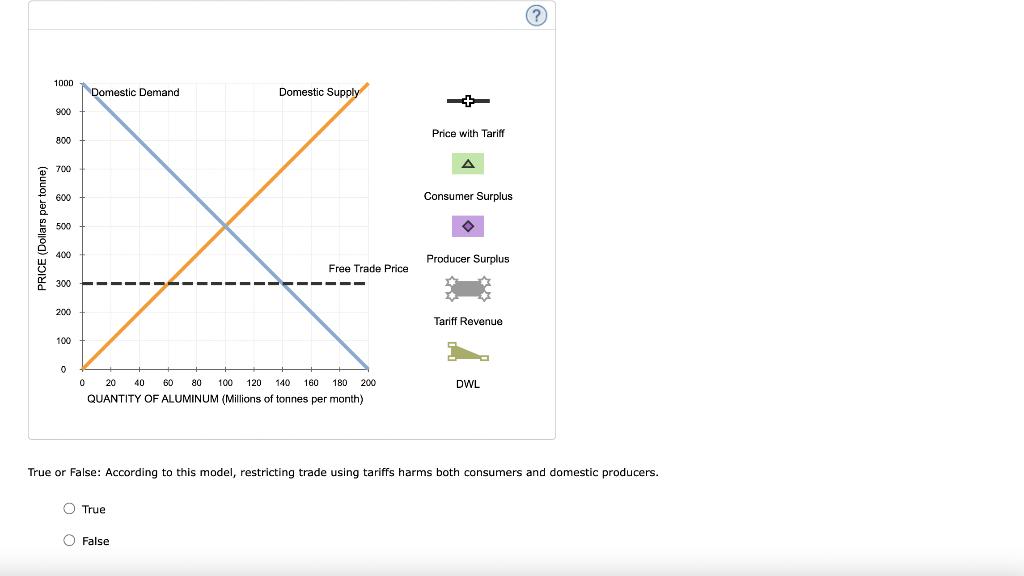
2. The impact of a tariff Consider a hypothetical example of trade in aluminum between the United States and China. For simplicity, assume that China is the only source of U.S. aluminum imports. The following graph shows the U.S. market for aluminum. Note that in the absence of any trade, the market price for aluminum in the United States. $500 per tonne, and the equilibrium quantity is 100 million tonnes per month. Use the green area (triangle symbol) to show U.S. consumer surplus under free trade with China, and use the purple area (diamond symbol) to show U.S. producer surplus under free trade with China. PRICE (Dollars per tonne) 1000 900 800 700 600 500 400 300 200 100 0 0 Domestic Demand 20 Domestic Supply Z Free Trade Price 40 60 80 100 120 140 160 180 200 Consumer Surplus Producer Surplus (?) Use the previous graph to complete the first row of the following table by indicating the quantity of aluminum supplied by U.S. producers, demanded by U.S. consumers, and imported from China under free trade. Free Trade Trade with Tariff Quantity Supplied by U.S. Producers (Millions of tonnes of aluminum per month) Quantity Demanded by U.S. Consumers (Millions of tonnes of aluminum per month) Quantity Imported from China (Millions of tonnes of aluminum per month) Suppose American aluminum manufacturers convince the U.S. government that Chinese firms are selling aluminum in the U.S. market at well below the cost of producing the aluminum, a practice known as dumping. In response to the accusations, the U.S. government puts a tariff of $100 per tonne on aluminum from China. The tariff increases the price of aluminum from $300 to $ per tonne. Complete the second row of the previous table by indicating the quantity of aluminum supplied by U.S. producers, demanded by U.S. consumers, and imported from China in the presence of a $100-per-tonne tariff. On the following graph, use the black line (cross symbol) to indicate the domestic price of aluminum in the presence of a $100-per-tonne tariff. Then use the green area (triangle symbol) to shade the area that represents consumer surplus under the tariff, and use the purple area (diamond symbol) to shade the area that represents producer surplus under the tariff. Finally, use the grey rectangle (star symbols) to show the revenue that the U.S. government collects as a result of the tariff, and use the tan triangles (dash symbols) to show the deadweight loss (DWL) from the imposition of the tariff. Note: There are two DWL triangles. Plot the right-most DWL triangle first, then plot the left-most DWL triangle after that. Plotting the DWL triangles out of order may cause your answer to be graded incorrectly. 1000 PRICE (Dollars per tonne) Domestic Demand Free Trade Price 9:00 800 700 600 500 400 300 200 100 0 0 Domestic Supply 140 160 180 200 20 40 60 80 100 120 QUANTITY OF ALUMINUM (Millions of tonnes per month) True O False Price with Tariff Consumer Surplus Producer Surplus Tariff Revenue True or False: According to this model, restricting trade using tariffs harms both consumers and domestic producers. DWL
Step by Step Solution
3.47 Rating (163 Votes )
There are 3 Steps involved in it
When country imposes tariff c... View full answer

Get step-by-step solutions from verified subject matter experts