

Question: 1) Calculate the actual percentage of all your 25 measurements which lie between Xs (show these calculations). Does your result differ from those expected for
1) Calculate the actual percentage of all your 25 measurements which lie between Xs (show these calculations). Does your result differ from those expected for a pure Gaussian distribution?
2) Suppose your lab partner was talking to the students at an adjacent lab table when you started the timer. As a result, the time registered on the timer when it was stopped was 10 seconds. How many standard deviations (s) does this represent? Should you include this data point with the rest of your data? Why or why not?
3) If you have already taken 25 measurements, how many more measurements of reaction time would you have to take to reduce Som by a factor of two? Justify your response.
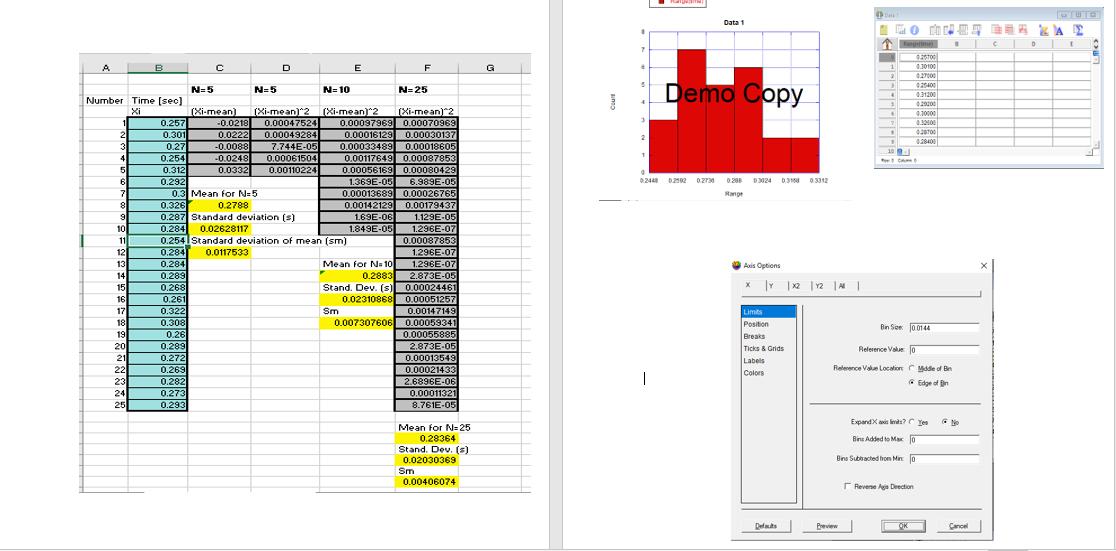
A Number Time [sec] Xi 1 2 3 4 5 6 7 8 9 10 11 12 13 14 15 B 16 17 18 19 20 21 22 23 24 25 0.257 0.301 0.27 0.254 0.312 0.292 0.284 0.289 0.268 N=5 0.261 0.322 0.308 C 0.26 0.289 0.272 0.269 0.282 0.273 0.293 0.3 Mean for N=5 0.2788 N=5 (Xi-mean) D N=10 N=25 (Xi-mean)^2 (Xi-mean)^2 (Xi-mean) 2 -0.0218 0.00047524 0.0222 0.00049284 -0.0088 7.744E-05 -0.0248 0.00061504 0.0332 0.00110224 0.326 0.287 Standard deviation (s) 0.284 0.02628117 0.254 Standard deviation of mean (sm) 0,284 0.0117533 E 0.00097969 0.00070969 0.00016129 0.00030137 0.00033489 0.00018605 0.00117649 0.00087853 0.00056169 0.00080429 1.369E-05 6.989E-05 0.00013689 0.00026765 0.00142129 0.00179437 1.69E-06 1.849E-05 Mean for N. 10 0.2883 Sm Stand. Dev. (s) 0.02310868 F 0.007307606 1.129E-05 1.296E-07 0.00087853 1.296E-07 1.296E-07 2.873E-05 0.00024461 0.00051257 0.00147149 0.00059341 0.00055885 2.873E-05 0.00013549 0.00021433 2.6896E-06 0.00011321 8.761E-05 Mean for N=25 0.28364 Stand. Dev. (s) 0.02030369 0.00406074 Sm 7 5 3 2 Rangkan 1 Data 1 Demo Copy 9 0.2448 02592 0.2730 0.208 0.288 03024 0.3158 03312 Range Axis Options X | Y | X2 | 12 | A | Limits Position Breaks Ticks & Grids Labels Colors Defacts H HONOR DE CD Preview T 1 2 J 4 3 4 7 1 1 10 C 026700 0.30100 0.27000 020400 0.31200 Bin Sice: 00144 Reference Value 0 Relence Value Location Middle of B @Edge of n Reverse Age Drection 029200 com 4.30000 0.32400 020700 028400 ExpandXlms? Yes Bins Added to Max 0 Bins Subtracted from Min 0 OK . No Cancel QUO t
Step by Step Solution
There are 3 Steps involved in it
1 Calculate the actual percentage of all your 25 measurements which lie between Xs show these calculations Does your result differ from those expected for a pure Gaussian distribution Answer To calcul... View full answer

Get step-by-step solutions from verified subject matter experts