

Question: Hamlet acquires a 7-year class asset on November 23, 2020, for $172,200 (the only asset acquired during the year). Hamlet does not elect Immediate
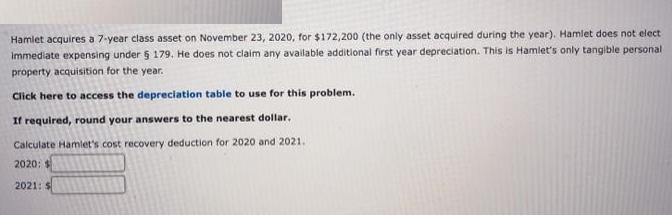
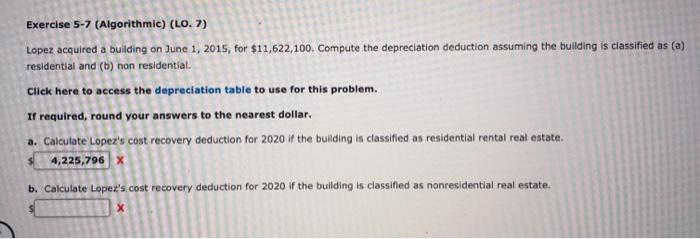
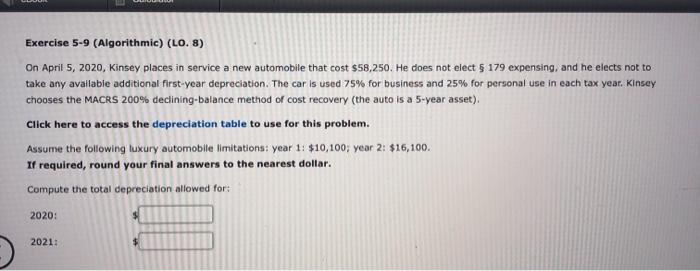
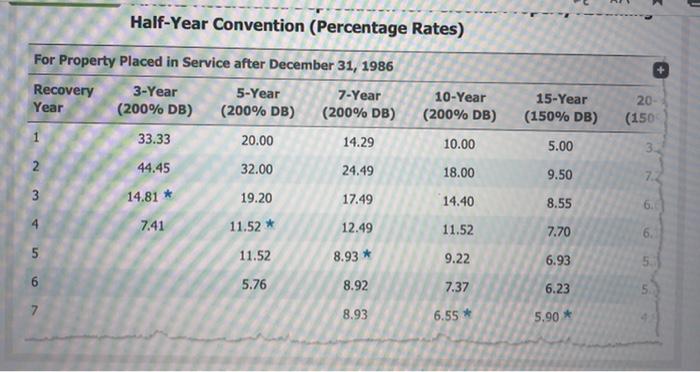
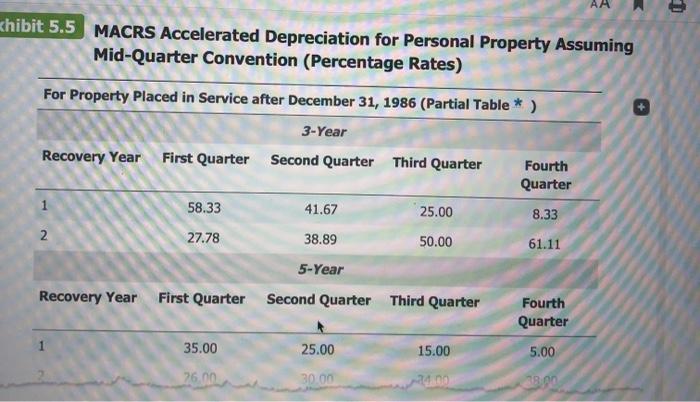
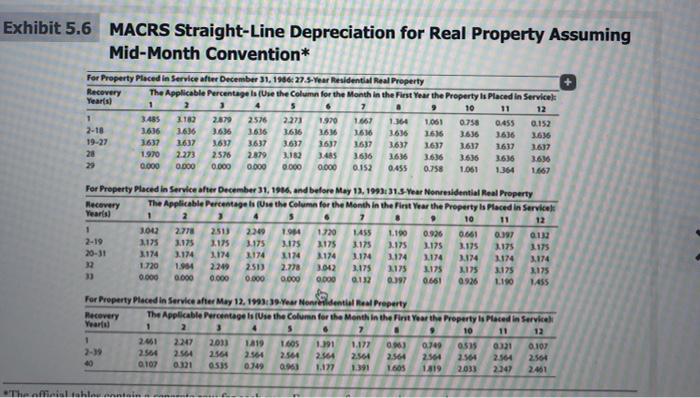
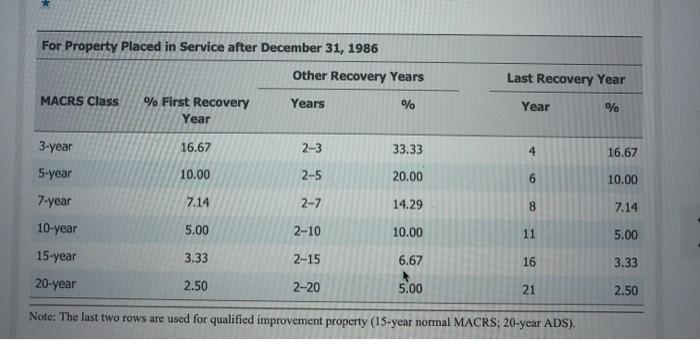
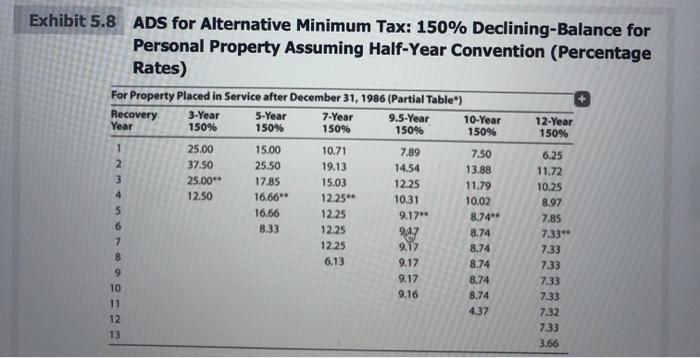
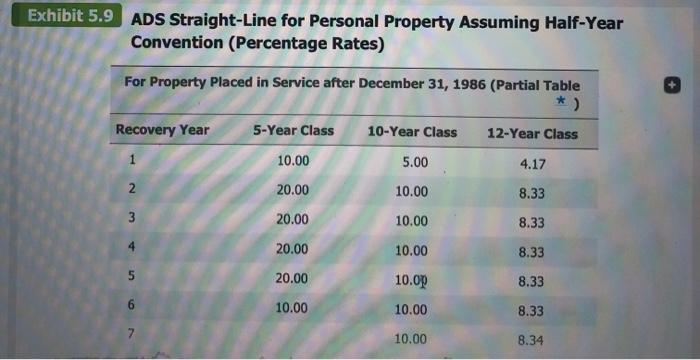
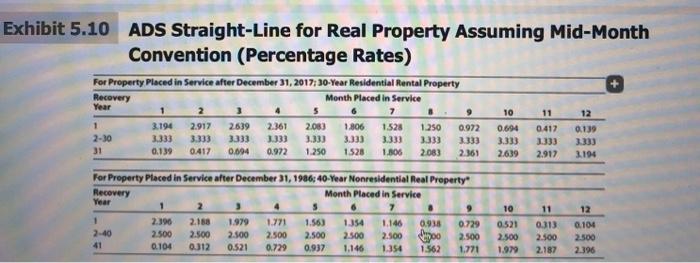
Hamlet acquires a 7-year class asset on November 23, 2020, for $172,200 (the only asset acquired during the year). Hamlet does not elect Immediate expensing under 5 179. He does not claim any available additilonal first year depreciation. This is Hamlet's only tangible personal property acquisition for the year. Click here to access the depreciation table to use for this problem. If required, round your answers to the nearest dollar. Calculate Hamlet's cost recovery deduction for 2020 and 2021. 2020: $ 2021: $ Exercise 5-7 (Algorithmic) (LO. 7) Lopez acquired a building on June 1, 2015, for $11,622,100. Compute the depreciation deduction assuming the building is classified as (a) residential and (b) non residential. Click here to access the depreciation table to use for this problem. If required, round your answers to the nearest dollar. a. Calculate Lopez's cost recovery deduction for 2020 if the building is classified as residential rental real estate. 4,225,796 x b. Calculate Lopez's cost recovery deduction for 2020 if the building is classifled as nonresidential real estate. Exercise 5-9 (Algorithmic) (LO. 8) On April 5, 2020, Kinsey places in service a new automobile that cost $58,250. He does not elect 5 179 expensing, and he elects not to take any available additional first-year depreciation. The car is used 75% for business and 25% for personal use in each tax year. Kinsey chooses the MACRS 200% declining-balance method of cost recovery (the auto is a 5-year asset). Click here to access the depreciation table to use for this problem. Assume the following luxury automobille limitations: year 1: $10,100; year 2: $16,100. If required, round your final answers to the nearest dollar. Compute the total depreciation allowed for: 2020: 2021: Half-Year Convention (Percentage Rates) For Property Placed in Service after December 31, 1986 3-Year 5-Year 7-Year 10-Year 15-Year 20- Recovery Year (200% DB) (200% DB) (200% DB) (200% DB) (150% DB) (150 33.33 20.00 14.29 10.00 5.00 44.45 32.00 24.49 18.00 9.50 7.2 3 14.81 * 19.20 17.49 14.40 8.55 7.41 11.52 * 12.49 11.52 7.70 5. 11.52 8.93 * 9.22 6.93 5.76 8.92 7.37 6.23 8.93 6.55 * 5.90* 67 AA khibit 5.5 MACRS Accelerated Depreciation for Personal Property Assuming Mid-Quarter Convention (Percentage Rates) For Property Placed in Service after December 31, 1986 (Partial Table *) 3-Year Recovery Year First Quarter Second Quarter Third Quarter Fourth Quarter 58.33 41.67 25.00 8.33 27.78 38.89 50.00 61.11 5-Year Recovery Year First Quarter Second Quarter Third Quarter Fourth Quarter 35.00 25.00 15.00 5.00 76,00 30.00 24.00 Exhibit 5.6 MACRS Straight-Line Depreciation for Real Property Assuming Mid-Month Convention* For Property Placed in Service after December 31, 1986 27.5-Year Residential Real Property Recovery Year(s) The Applicable Percentage ls (Ue the Column for the Month in the First Year the Property is Placed in Service) 10 11 12 3.485 3.182 2879 2273 3616 2576 1970 1667 1.364 1,061 0.758 0.455 0.152 2-18 3636 3636 3636 3636 3636 3636 1616 3.636 3636 3636 19-27 3637 1637 3637 3637 3.637 3637 3637 3637 1637 3.617 1637 3.617 28 1.970 2.273 2576 2879 3.485 3636 3636 3.636 3.636 3636 3636 29 0.000 0.000 0.000 0.000 0.000 0.000 0.152 0.455 0.758 1.061 1.364 1667 For Property Placed in Service after December 31, 1986, and before May 13, 1993 31.5-Year Nonresidential Real Property The Applicable Percentage s (Use the Column for the Month in the First Vear the Property Is Placed in Service Recovery Yearls) 10 11 12 3042 3175 2.778 2513 2249 1.984 1720 LASS 1.190 0.926 0.97 2-19 3.175 3.175 3.175 3.175 3175 3174 3.042 3.175 3.175 3.174 A175 3.175 3.175 3175 3.175 20-31 3.174 3.174 174 3174 174 3.174 3.174 3174 3174 3174 32 1720 1.984 2249 2513 2.778 3.175 L175 0661 3175 L190 3175 1455 33 0.000 0.000 0.000 0.000 0.00 0000 097 0926 For Property Placed in Service after May 12. 1993:39-Year Nonresldential Real Property Recovery Yearta) The Applicable Percentage s Use the Column for the Month in the First Year the Property ls Placed in Service 1. 7. 10 11 12 2461 2247 2013 L419 1605 1391 1.177 0.749 0321 0.107 2-39 2.564 2.564 2564 2.564 2.564 2564 2.564 2.564 2564 1819 2.564 2.564 2564 40 0107 0321 0535 0349 1.391 1.605 2033 2347 2461 The offieial ahla ne For Property Placed in Service after December 31, 1986 Other Recovery Years Last Recovery Year MACRS Class % First Recovery Years % Year Year 3-year 16.67 2-3 33.33 4 16.67 5-year 10.00 2-5 20.00 6. 10.00 7-year 7.14 2-7 14.29 8. 7.14 10-year 5.00 2-10 10.00 11 5.00 15-year 3.33 2-15 6.67 16 3.33 20-year 2.50 2-20 5.00 21 2.50 Note: The last two rows are used for qualified improvement property (15-year normal MACRS; 20-year ADS). Exhibit 5.8 ADS for Alternative Minimum Tax: 150% Declining-Balance for Personal Property Assuming Half-Year Convention (Percentage Rates) For Property Placed in Service after December 31, 1986 (Partial Table") Recovery Year 3-Year 150% 5-Year 7-Year 150% 9.5-Year 150% 10-Year 150% 12-Year 150% 150% 25.00 15.00 10.71 7.89 7.50 6.25 2. 37.50 25.50 19.13 14.54 13.88 11.72 3. 25.00** 17.85 15.03 12.25 11.79 10.25 4. 12.50 16.66** 12.25** 10.31 10.02 8.97 16.66 8.33 12.25 9.17** 8.74* 7.85 12.25 8.74 7.33** 7. 12.25 9.17 8.74 7.33 8. 6.13 9.17 8.74 7.33 6. 9.17 8.74 7.33 10 9.16 8.74 7.33 11 4.37 7.32 12 7.33 13 3.66 Exhibit 5.9 ADS Straight-Line for Personal Property Assuming Half-Year Convention (Percentage Rates) For Property Placed in Service after December 31, 1986 (Partial Table * ) Recovery Year 5-Year Class 10-Year Class 12-Year Class 1 10.00 5.00 4.17 20.00 10.00 8.33 3 20.00 10.00 8.33 20.00 10.00 8.33 20.00 10.0p 8.33 10.00 10.00 8.33 10.00 8.34 Exhibit 5.10 ADS Straight-Line for Real Property Assuming Mid-Month Convention (Percentage Rates) For Property Placed in Service after December 31, 2017: 30-Year Residential Rental Property Recovery Year Month Placed in Service 10 11 12 1. 2-30 3.194 2.917 2639 2.361 2.083 1.806 3.333 1528 1.250 0.972 3333 0.694 0.417 0.139 3.333 3.333 3333 3333 3.333 3.333 3333 3.333 3.333 3.333 31 0.139 0417 0.004 0.972 1.250 1528 1806 2.083 2.361 2.639 2.917 3.194 For Property Placed in Service after December 31, 1986; 40-Year Nonresidential Real Property Recovery Year Month Placed in Service 2. 4. 6. 10 11 12 2.396 2.500 2.188 1.979 1.771 1.563 1.354 1.146 0.938 0.729 0.21 0313 0.104 2-40 2.500 2.500 2.500 0.729 2.500 2500 2.500 2.500 2500 2.500 2500 41 0.104 0312 0.521 0.937 1,146 1354 1.562 1.771 1.979 2.187 2.396
Step by Step Solution
3.44 Rating (154 Votes )
There are 3 Steps involved in it
2020 7 years depreciation rate for class property for the first year by ... View full answer

Get step-by-step solutions from verified subject matter experts