

After completing the last #2-Assignment (Financial Modeling Projections), a fully completed Integrated Financial Model-Startup AB has...
Fantastic news! We've Found the answer you've been seeking!
Question:

Transcribed Image Text:
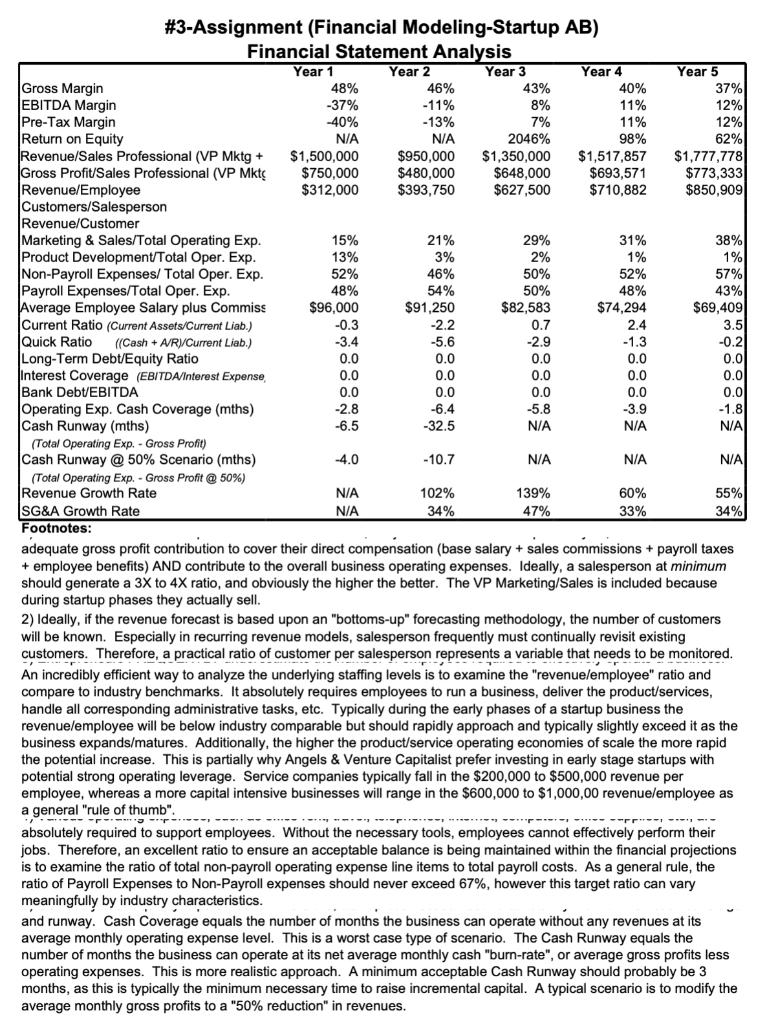
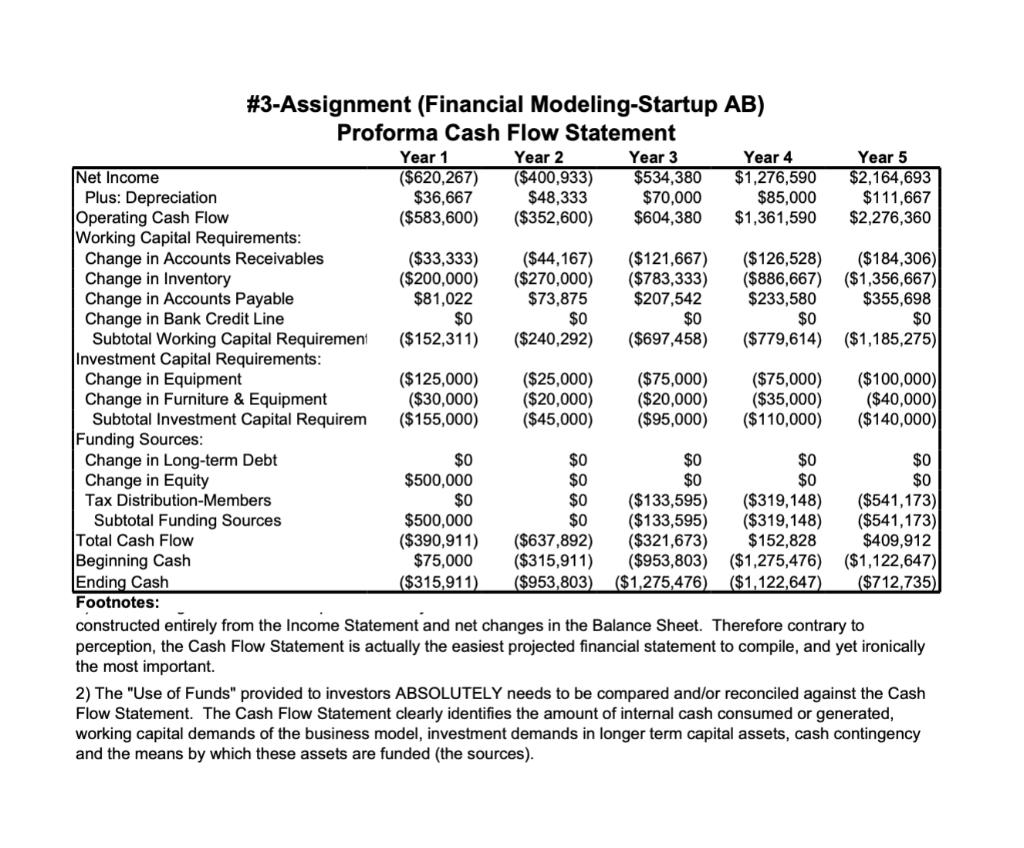
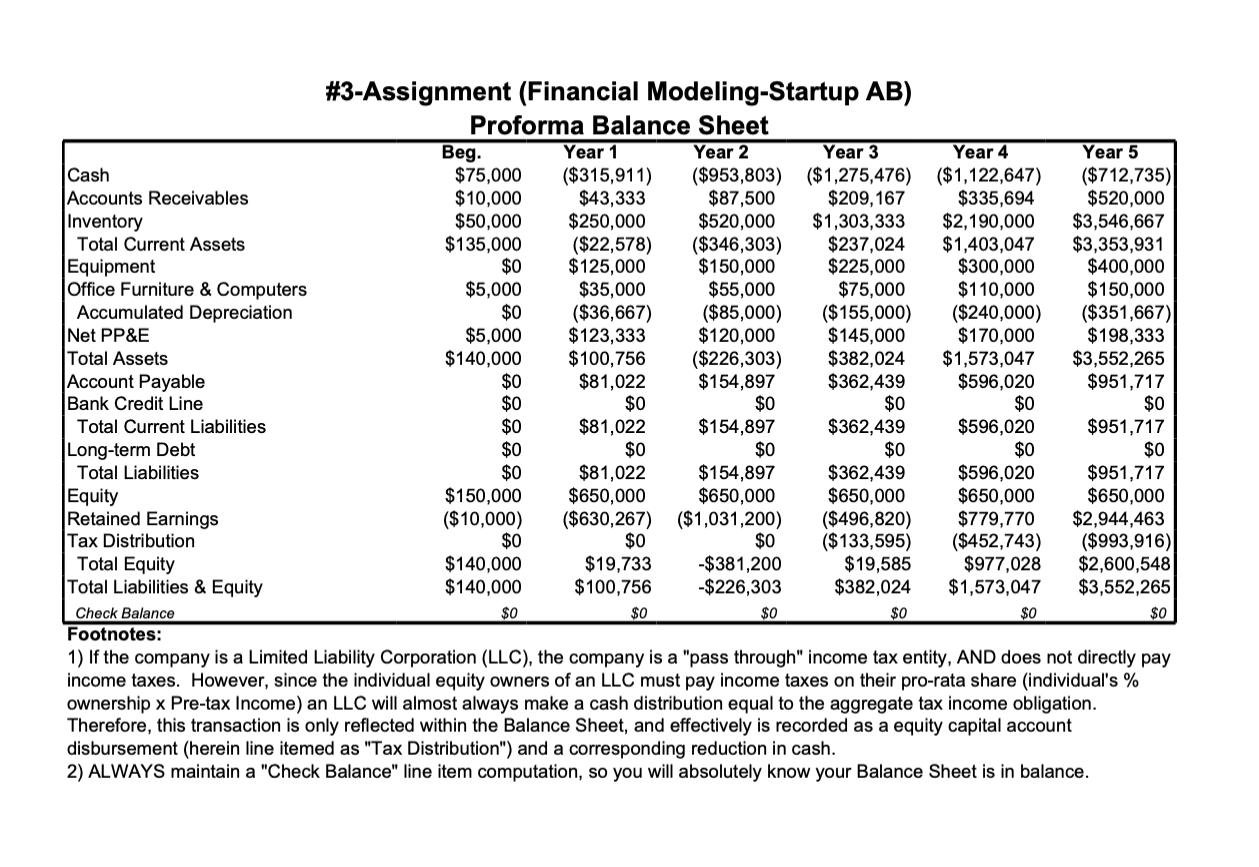
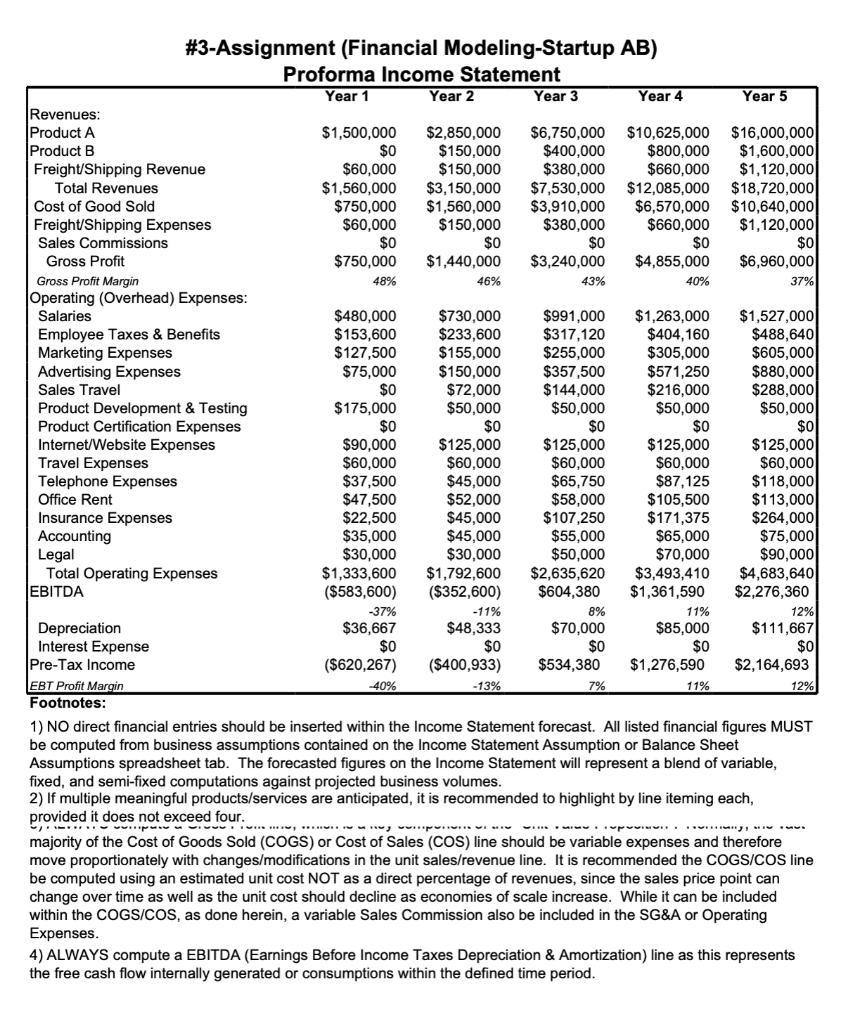
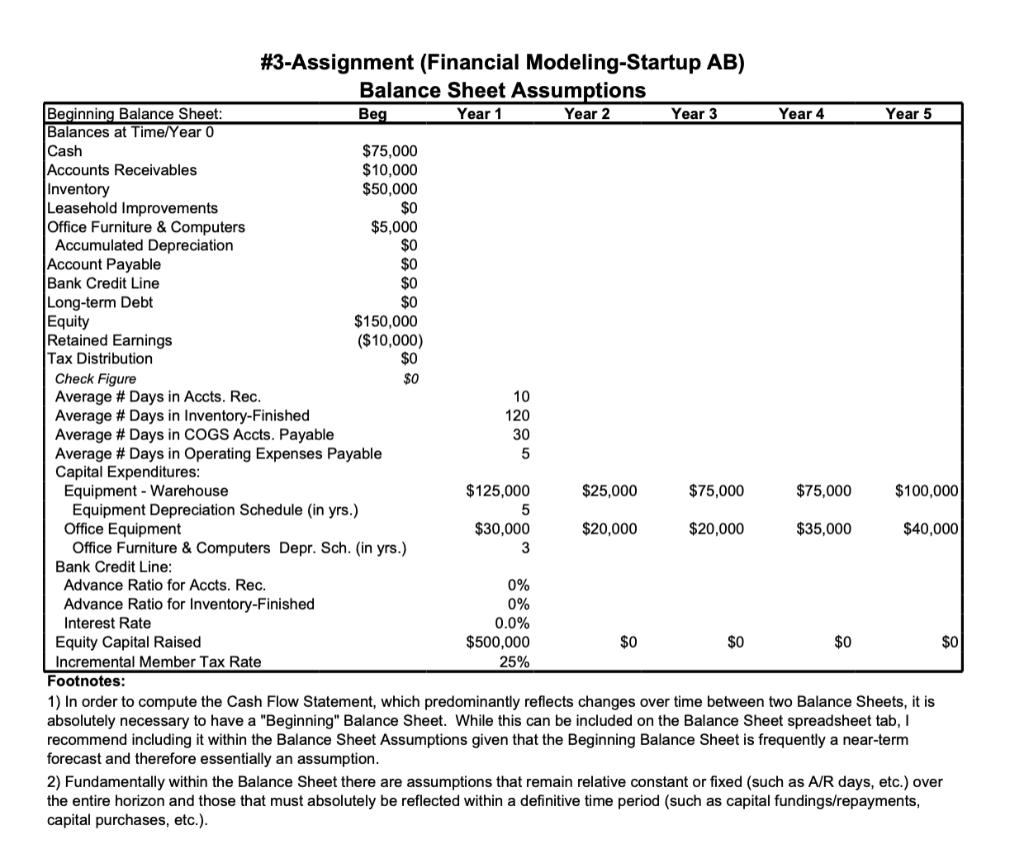
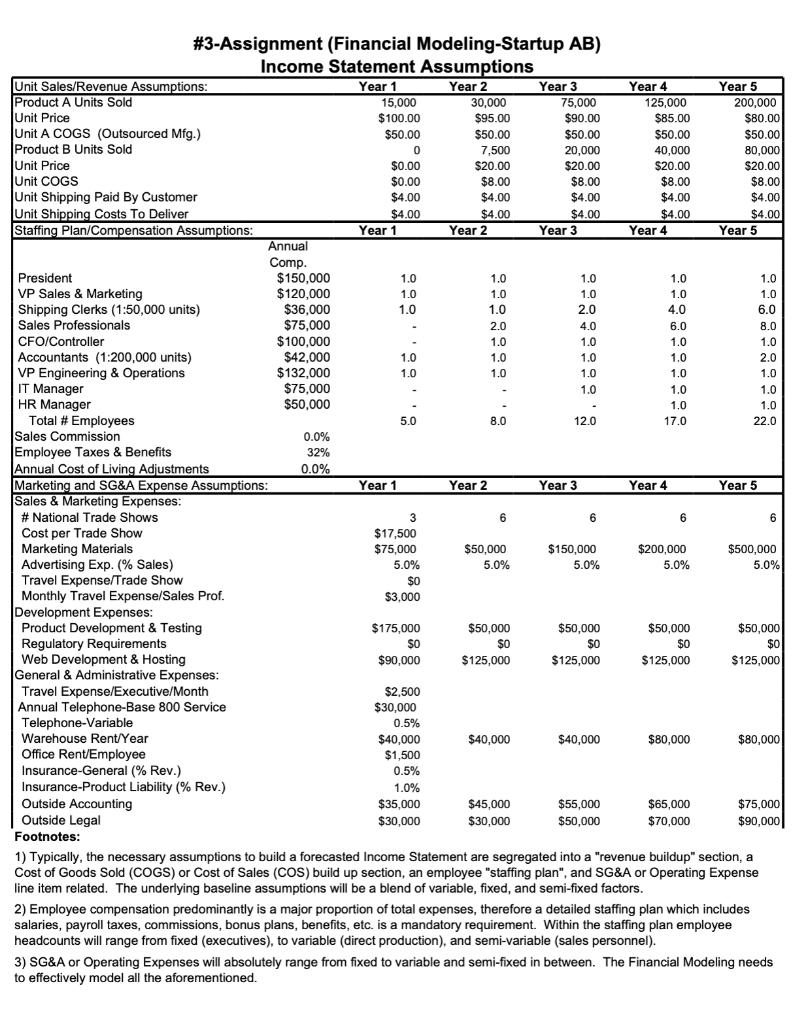
After completing the last #2-Assignment (Financial Modeling Projections), a fully completed Integrated Financial Model-Startup AB has been constructed based upon the Co-Founder's initial business decisions and plans for the Startup. Based upon these previously stated set of Income Statement & Balance Sheet input assumptions, Startup AB has a "negative" cash balance for Years 1 thru 5, which is unacceptable. Obviously, Startup AB CANNOT operate as a viable business with a negative cash balance. Therefore, the executive management team must thoughtfully modify several of the "adjustable or manageable" business input assumptions within either the Income Statement Assumptions and/or Balance Sheet Assumptions until creating sufficient (i.e. adequate cash liquidity) positive Cash Balances across ALL five years. No single input assumption in either the Income Statement Assumptions tab or Balance Sheet Assumptions tab (i.e. remember do NOT adjust financial values within the Income Statement, Balance Sheet or Cash Flow Statement tabs), can be modified by more than +/- 25%, except for the Year 1 Equity Capital investment which is subject to a +/- $450,000 aggregate adjustment limit. However, any required incremental aggregate Equity Capital investment Assumptions amount after Year 1 has no percentage, since currently all input amounts are zero, or aggregate amount adjustment limitations. The focus on this "Capital Funding Strategy" needs to be on items or input business variables/assumptions that can reasonably be controlled or independently influenced by the executive management team. For example, it is not realistic or reasonable to assume that the current forecasted & negotiated Unit Price from the external manufacturer can be dramatically lowered or discounted, or that the large Year 1 Product Development Expenses can be dramatically cut/reduced and the Startup still be able to introduce Product A in Year 2 on time UNLESS the introduction timeframe is also proportionately pushed back. The offsetting ramifications of any modification or adjustment to the input business assumptions must be considered. In a Word document, prepare a prioritized list of recommendations and your supporting rationale or justification for each recommended modification to the corresponding Input Assumption for the executive management team. The supporting justification for each recommendation should not exceed a short paragraph. Each recommended Input Assumption modification must then be entered into the #3-Assignment (Financial Modeling-Startup AB). HIGHLIGHT ALL MODIFIED CELLS within this #3- Assigment (Financial Modeling-Startup AB) in "Yellow". Remember that the cumulative impact from implementing ALL your recommendations must be the creation of a viable financial capital strategy (i.e. a sufficient annual positive cash liquidity balance throughout all five years). Submit these two documents/files cumulatively depicting and justifying an acceptable "Capital Funding Strategy" (i.e. creates positive annual cash balances through implementation of the aforementioned itemized recommendations). # 3-Assignment (Financial Modeling-Startup AB) Financial Statement Analysis Year 2 Year 3 43% Year 4 Year 5 37% Year 1 Gross Margin EBITDA Margin Pre-Tax Margin Return on Equity Revenue/Sales Professional (VP Mktg + Gross Profit/Sales Professional (VP Mktg Revenue/Employee Customers/Salesperson Revenue/Customer Marketing & Sales/Total Operating Exp. Product Development/Total Oper. Exp. Non-Payroll Expenses/ Total Oper. Exp. Payroll Expenses/Total Oper. Exp. Average Employee Salary plus Commiss Current Ratio (Current Assets/Current Liab.) Quick Ratio Long-Term Debt/Equity Ratio Interest Coverage (EBITDA/Interest Expense Bank Debt/EBITDA Operating Exp. Cash Coverage (mths) Cash Runway (mths) (Total Operating Exp. - Gross Profit) Cash Runway @ 50% Scenario (mths) 48% -37% 46% 40% 12% 12% -11% 11% 8% 7% -40% -13% 11% 98% N/A N/A 2046% 62% $1,500,000 $750,000 $312,000 $950,000 $480,000 $393,750 $1,350,000 $648,000 $627,500 $1,517,857 $693,571 $710,882 $1,777,778 $773.333 $850,909 38% 1% 15% 21% 29% 31% 13% 52% 3% 2% 1% 50% 50% 52% 48% 46% 57% 48% 54% 43% $96,000 $91,250 $82,583 $74,294 $69,409 -0.3 -3.4 -2.2 0.7 2.4 3.5 ((Cash + A/R/Current Liab.) -5.6 -2.9 -1.3 -0.2 0.0 0.0 0.0 0.0 0.0 0.0 0.0 0.0 0.0 0.0 0.0 0.0 0.0 0.0 0.0 -5.8 N/A -2.8 -6.4 -3.9 -1.8 -6.5 -32.5 N/A N/A -4.0 -10.7 N/A N/A N/A (Total Operating Exp. - Gross Profit @ 50%) Revenue Growth Rate SG&A Growth Rate Footnotes: N/A 102% 139% 60% 55% N/A 34% 47% 33% 34% adequate gross profit contribution to cover their direct compensation (base salary + sales commissions + payroll taxes + employee benefits) AND contribute to the overall business operating expenses. Ideally, a salesperson at minimum should generate a 3X to 4X ratio, and obviously the higher the better. The VP Marketing/Sales is included because during startup phases they actually sell. 2) Ideally, if the revenue forecast is based upon an "bottoms-up" forecasting methodology, the number of customers will be known. Especially in recurring revenue models, salesperson frequently must continually revisit existing customers. Therefore, a practical ratio of customer per salesperson represents a variable that needs to be monitored. An incredibly efficient way to analyze the underlying staffing levels is to examine the "revenue/employee" ratio and compare to industry benchmarks. It absolutely requires employees to run a business, deliver the product/services, handle all corresponding administrative tasks, etc. Typically during the early phases of a startup business the revenuelemployee will be below industry comparable but should rapidly approach and typically slightly exceed it as the business expands/matures. Additionally, the higher the product/service operating economies of scale the more rapid the potential increase. This is partially why Angels & Venture Capitalist prefer investing in early stage startups with potential strong operating leverage. Service companies typically fall in the $200,000 to $500,000 revenue per employee, whereas a more capital intensive businesses will range in the $600,000 to $1,000,00 revenuelemployee as general "rule of thumb". . - -- - - ---- ****---rr-- ----- absolutely required to support employees. Without the necessary tools, employees cannot effectively perform their jobs. Therefore, an excellent ratio to ensure an acceptable balance is being maintained within the financial projections is to examine the ratio of total non-payroll operating expense line items to total payroll costs. As a general rule, the ratio of PayrolI Expenses to Non-Payroll expenses should never exceed 67%, however this target ratio can vary meaningfully by industry characteristics. and runway. Cash Coverage equals the number of months the business can operate without any revenues at its average monthly operating expense level. This is a worst case type of scenario. The Cash Runway equals the number of months the business can operate at its net average monthly cash "burn-rate", or average gross profits less operating expenses. This is more realistic approach. A minimum acceptable Cash Runway should probably be 3 months, as this is typically the minimum necessary time to raise incremental capital. A typical scenario is to modify the average monthly gross profits to a "50% reduction" in revenues. # 3-Assignment (Financial Modeling-Startup AB) Proforma Cash Flow Statement Year 1 Year 2 Year 3 Year 4 $1,276,590 $85,000 $1,361,590 Year 5 Net Income Plus: Depreciation Operating Cash Flow Working Capital Requirements: Change in Accounts Receivables Change in Inventory Change in Accounts Payable Change in Bank Credit Line Subtotal Working Capital Requirement Investment Capital Requirements: Change in Equipment Change in Furniture & Equipment Subtotal Investment Capital Requirem Funding Sources: Change in Long-term Debt Change in Equity ($620,267) $36,667 ($583,600) ($400,933) $48,333 ($352,600) $534,380 $70,000 $604,380 $2,164,693 $111,667 $2,276,360 ($44,167) ($270,000) $73,875 $0 ($240,292) ($121,667) ($783,333) $207,542 $0 ($697,458) ($184,306) ($886,667) ($1,356,667) $355,698 $0 ($779,614) ($1,185,275) ($126,528) ($33,333) ($200,000) $81,022 $0 ($152,311) $233,580 $0 ($125,000) ($30,000) ($155,000) ($25,000) ($20,000) ($45,000) ($75,000) ($20,000) ($95,000) ($75,000) ($35,000) ($110,000) ($100,000) ($40,000) ($140,000) $0 $500,000 $0 $500,000 ($390,911) $75,000 $0 $0 ($541,173) ($541,173) $409,912 ($1,275,476) ($1,122,647) ($712,735) $0 $0 $0 $0 ($637,892) ($315,911) ($953,803) $0 $0 ($133,595) ($133,595) ($321,673) ($953,803) ($1,275,476) $0 $0 ($319,148) ($319,148) $152,828 Tax Distribution-Members Subtotal Funding Sources Total Cash Flow Beginning Cash Ending Cash Footnotes: ($315,911) ($1,122,647) constructed entirely from the Income Statement and net changes in the Balance Sheet. Therefore contrary to perception, the Cash Flow Statement is actually the easiest projected financial statement to compile, and yet ironically the most important. 2) The "Use of Funds" provided to investors ABSOLUTELY needs to be compared and/or reconciled against the Cash Flow Statement. The Cash Flow Statement clearly identifies the amount of internal cash consumed or generated, working capital demands of the business model, investment demands in longer term capital assets, cash contingency and the means by which these assets are funded (the sources). # 3-Assignment (Financial Modeling-Startup AB) Proforma Balance Sheet Year 2 Beg. $75,000 $10,000 $50,000 $135,000 $0 $5,000 $0 $5,000 $140,000 $0 $0 $0 $0 $0 $150,000 ($10,000) $0 $140,000 $140,000 Year 4 Year 1 ($315,911) $43,333 $250,000 ($22,578) $125,000 $35,000 ($36,667) $123,333 $100,756 $81,022 $0 $81,022 $0 $81,022 $650,000 ($630,267) $0 $19,733 $100,756 Year 3 ($953,803) ($1,275,476) ($1,122,647) $209,167 $1,303,333 $237,024 $225,000 $75,000 ($155,000) $145,000 $382,024 $362,439 $0 $362,439 $0 $362,439 $650,000 ($496,820) ($133,595) $19,585 $382,024 Year 5 ($712,735) $520,000 $3,546,667 $3,353,931 $400,000 $150,000 ($351,667) $198,333 $3,552,265 $951,717 $0 $951,717 $0 $951,717 $650,000 $2,944,463 ($993,916) $2,600,548 $3,552,265 Cash Accounts Receivables $87,500 $520,000 ($346,303) $150,000 $55,000 ($85,000) $120,000 ($226,303) $154,897 $0 $154,897 $0 $154,897 $650,000 ($1,031,200) $0 -$381,200 -$226,303 $335,694 $2,190,000 $1,403,047 $300,000 $110,000 ($240,000) $170,000 $1,573,047 $596,020 $0 $596,020 $0 $596,020 $650,000 $779,770 ($452,743) $977,028 $1,573,047 Inventory Total Current Assets Equipment Office Furniture & Computers Accumulated Depreciation Net PP&E Total Assets Account Payable Bank Credit Line Total Current Liabilities Long-term Debt Total Liabilities Equity Retained Earnings Tax Distribution Total Equity Total Liabilities & Equity Check Balance $0 $0 $0 $0 $0 $0 Footnotes: 1) If the company is a Limited Liability Corporation (LLC), the company is a "pass through" income tax entity, AND does not directly pay income taxes. However, since the individual equity owners of an LLC must pay income taxes on their pro-rata share (individual's % ownership x Pre-tax Income) an LLC will almost always make a cash distribution equal to the aggregate tax income obligation. Therefore, this transaction is only reflected within the Balance Sheet, and effectively is recorded as a equity capital account disbursement (herein line itemed as "Tax Distribution") and a corresponding reduction in cash. 2) ALWAYS maintain a "Check Balance" line item computation, so you will absolutely know your Balance Sheet is in balance. # 3-Assignment (Financial Modeling-Startup AB) Proforma Income Statement Year 2 Year 1 Year 3 Year 4 Year 5 Revenues: Product A Product B Freight/Shipping Revenue Total Revenues $1,500,000 $0 $60,000 $1,560,000 $750,000 $60,000 $0 $750,000 $2,850,000 $150,000 $150,000 $3,150,000 $1,560,000 $150,000 $0 $1,440,000 $6,750,000 $10,625,000 $800,000 $660,000 $12,085,000 $6,570,000 $660,000 $0 $4,855,000 $400,000 $380,000 $7,530,000 $3,910,000 $380,000 $0 $3,240,000 $16,000,000 $1,600,000 $1,120,000 $18,720,000 $10,640,000 $1,120,000 $0 $6,960,000 Cost of Good Sold Freight/Shipping Expenses Sales Commissions Gross Profit Gross Profit Margin 48% 46% 43% 40% 37% Operating (Overhead) Expenses: Salaries $730,000 $233,600 $155,000 $150,000 $72,000 $50,000 $0 $480,000 $153,600 $127,500 $75,000 $0 $175,000 $0 $90,000 $60,00 $37,500 $47,500 $22,500 $35,000 $30,000 $1,333,600 ($583,600) $991,000 $317,120 $255,000 $357,500 $144,000 $50,000 $0 $125,000 $60,000 $65,750 $58,000 $107,250 $55,000 $50,000 $2,635,620 $604,380 $1,263,000 $404,160 $305,000 $571,250 $216,000 $50,000 $0 $125,000 $60,000 $87,125 $105,500 $171,375 $65,000 $70,000 $3,493,410 $1,361,590 $1,527,000 $488,640 $605,000 $880,000| $288,000 $50,000 $0 $125,000 $60,000 $118,000 $113,000 $264,000 $75,000 $90,000 $4,683,640 $2,276,360 12% $111,667 $0 $2,164,693 Employee Taxes & Benefits Marketing Expenses Advertising Expenses Sales Travel Product Development & Testing Product Certification Expenses Internet/Website Expenses Travel Expenses Telephone Expenses Office Rent Insurance Expenses Accounting Legal Total Operating Expenses EBITDA $125,000 $60,000 $45,000 $52,000 $45,000 $45,000 $30,000 $1,792,600 ($352,600) -37% -11% 8% 11% Depreciation Interest Expense Pre-Tax Income $36,667 $0 ($620,267) $48,333 $0 $70,000 $0 $534,380 $85,000 $0 $1,276,590 ($400,933) EBT Profit Margin -40% -13% 7% 11% 12% Footnotes: 1) NO direct financial entries should be inserted within the Income Statement forecast. All listed financial figures MUST be computed from business assumptions contained on the Income Statement Assumption or Balance Sheet Assumptions spreadsheet tab. The forecasted figures on the Income Statement will represent a blend of variable, fixed, and semi-fixed computations against projected business volumes. 2) If multiple meaningful products/services are anticipated, it is recommended to highlight by line iteming each, provided nd.p majority of the Cost of Goods Sold (COGS) or Cost of Sales (COS) line should be variable expenses and therefore move proportionately with changes/modifications in the unit sales/revenue line. It is recommended the COGS/COS line be computed using an estimated unit cost NOT as a direct percentage of revenues, since the sales price point can change over time as well as the unit cost should decline as economies of scale increase. While it can be included within the COGS/COS, as done herein, a variable Sales Commission also be included in the SG&A or Operating Expenses. it does not exceed four. .. y . 4) ALWAYS compute a EBITDA (Earnings Before Income Taxes Depreciation & Amortization) line as this represents the free cash flow internally generated or consumptions within the defined time period. # 3-Assignment (Financial Modeling-Startup AB) Balance Sheet Assumptions Year 1 Year 2 Beginning Balance Sheet: Balances at Time/Year 0 Cash Accounts Receivables Inventory Leasehold Improvements Office Furniture & Computers Accumulated Depreciation Account Payable Bank Credit Line Long-term Debt Equity Retained Earnings Tax Distribution Check Figure Average # Days in Accts. Rec. Average # Days in Inventory-Finished Average # Days in COGS Accts. Payable Average # Days in Operating Expenses Payable Capital Expenditures: Equipment - Warehouse Equipment Depreciation Schedule (in yrs.) Office Equipment Office Furniture & Computers Depr. Sch. (in yrs.) Beg Year 3 Year 4 Year 5 $75,000 $10,000 $50,000 $0 $5,000 $0 $0 $0 $0 $150,000 ($10,000) $0 $0 10 120 30 $125,000 $25,000 $75,000 $75,000 $100,000 $30,000 $20,000 $20,000 $35,000 $40,000 3 Bank Credit Line: Advance Ratio for Accts. Rec. 0% 0% Advance Ratio for Inventory-Finished Interest Rate Equity Capital Raised 0.0% $500,000 $0 $0 $0 $0 Incremental Member Tax Rate Footnotes: 25% 1) In order to compute the Cash Flow Statement, which predominantly reflects changes over time between two Balance Sheets, it is absolutely necessary to have a "Beginning" Balance Sheet. While this can be included on the Balance Sheet spreadsheet tab, I recommend including it within the Balance Sheet Assumptions given that the Beginning Balance Sheet is frequently a near-term forecast and therefore essentially an assumption. 2) Fundamentally within the Balance Sheet there are assumptions that remain relative constant or fixed (such as A/R days, etc.) over the entire horizon and those that must absolutely be reflected within a definitive time period (such as capital fundings/repayments, capital purchases, etc.). # 3-Assignment (Financial Modeling-Startup AB) Income Statement Assumptions Year 1 15,000 $100.00 $50.00 Unit Sales/Revenue Assumptions: Product A Units Sold Unit Price Unit A COGS (Outsourced Mfg.) Product B Units Sold Unit Price Unit COGS Unit Shipping Paid By Customer Unit Shipping Costs To Deliver Staffing Plan/Compensation Assumptions: Year 2 30,000 $95.00 Year 4 125,000 $85.00 Year 5 200,000 $80.00 Year 3 75,000 $90.00 $50.00 7,500 $20.00 $8.00 $4.00 $4.00 Year 2 $50.00 $50.00 $50.00 20,000 $20.00 $8.00 $4.00 40,000 $20.00 $8.00 $4.00 80,000 $20.00 $8.00 $4.00 $4.00 Year 5 $0.00 $0.00 $4.00 $4.00 Year 1 $4.00 Year 3 $4.00 Year 4 Annual Comp. $150,000 President 1.0 1.0 1.0 1.0 1.0 VP Sales & Marketing $120,000 $36,000 $75,000 $100,000 $42,000 $132,000 $75,000 $50.000 1.0 1.0 1.0 1.0 1.0 Shipping Clerks (1:50,000 units) Sales Professionals 1.0 1.0 2.0 4.0 6.0 2.0 4.0 6.0 8.0 CFO/Controller 1.0 1.0 1.0 1.0 Accountants (1:200,000 units) 1.0 1.0 1.0 1.0 2.0 Engineering & Operations IT Manager HR Manager Total # Employees Sales Commission 1.0 1.0 1.0 1.0 1.0 1.0 1.0 1.0 1.0 1.0 5.0 8.0 12.0 17.0 22.0 0.0% Employee Taxes & Benefits 32% Annual Cost of Living Adjustments Marketing and SG&A Expense Assumptions: Sales & Marketing Expenses: 0.0% Year 1 Year 2 Year 3 Year 4 Year 5 # National Trade Shows Cost per Trade Show Marketing Materials 3 6 6 6 6 $17,500 $75,000 $50,000 $150,000 $200,000 5.0% $500,000 Advertising Exp. (% Sales) Travel Expense/Trade Show 5.0% 5.0% 5.0% 5.0% so Monthly Travel Expense/Sales Prof. Development Expenses: Product Development & Testing Regulatory Requirements Web Development & Hosting General & Administrative Expenses: General a Travel Expense/Executive/Month $3,000 $175,000 $50,000 $50,000 $50,000 $50,000 $0 $0 $0 $0 $0 $90,000 $125,000 $125,000 $125,000 $125,000 $2,500 Annual Telephone-Base 800 Service $30,000 Telephone-Variable Warehouse Rent/Year 0.5% $40,000 $40,000 $40,000 $80,000 $80,000 Office Rent/Employee $1,500 0.5% 1.0% Insurance-General (% Rev.) Insurance-Product Liability (% Rev.) Outside Accounting Outside Legal $75,000 $90,000 $35,000 $45,000 $55,000 $65,000 $30,000 $30,000 $50,000 $70,000 Footnotes: 1) Typically, the necessary assumptions to build a forecasted Income Statement are segregated into a "revenue buildup" section, a Cost of Goods Sold (COGS) or Cost of Sales (COS) build up section, an employee "staffing plan", and SG&A or Operating Expense line item related. The underlying baseline assumptions will be a blend of variable, fixed, and semi-fixed factors. 2) Employee compensation predominantly is a major proportion of total expenses, therefore a detailed staffing plan which includes salaries, payroll taxes, commissions, bonus plans, benefits, etc. is a mandatory requirement. Within the staffing plan employee headcounts will range from fixed (executives), to variable (direct production), and semi-variable (sales personnel). 3) SG&A or Operating Expenses will absolutely range from fixed to variable and semi-fixed in between. The Financial Modeling needs to effectively model all the aforementioned. After completing the last #2-Assignment (Financial Modeling Projections), a fully completed Integrated Financial Model-Startup AB has been constructed based upon the Co-Founder's initial business decisions and plans for the Startup. Based upon these previously stated set of Income Statement & Balance Sheet input assumptions, Startup AB has a "negative" cash balance for Years 1 thru 5, which is unacceptable. Obviously, Startup AB CANNOT operate as a viable business with a negative cash balance. Therefore, the executive management team must thoughtfully modify several of the "adjustable or manageable" business input assumptions within either the Income Statement Assumptions and/or Balance Sheet Assumptions until creating sufficient (i.e. adequate cash liquidity) positive Cash Balances across ALL five years. No single input assumption in either the Income Statement Assumptions tab or Balance Sheet Assumptions tab (i.e. remember do NOT adjust financial values within the Income Statement, Balance Sheet or Cash Flow Statement tabs), can be modified by more than +/- 25%, except for the Year 1 Equity Capital investment which is subject to a +/- $450,000 aggregate adjustment limit. However, any required incremental aggregate Equity Capital investment Assumptions amount after Year 1 has no percentage, since currently all input amounts are zero, or aggregate amount adjustment limitations. The focus on this "Capital Funding Strategy" needs to be on items or input business variables/assumptions that can reasonably be controlled or independently influenced by the executive management team. For example, it is not realistic or reasonable to assume that the current forecasted & negotiated Unit Price from the external manufacturer can be dramatically lowered or discounted, or that the large Year 1 Product Development Expenses can be dramatically cut/reduced and the Startup still be able to introduce Product A in Year 2 on time UNLESS the introduction timeframe is also proportionately pushed back. The offsetting ramifications of any modification or adjustment to the input business assumptions must be considered. In a Word document, prepare a prioritized list of recommendations and your supporting rationale or justification for each recommended modification to the corresponding Input Assumption for the executive management team. The supporting justification for each recommendation should not exceed a short paragraph. Each recommended Input Assumption modification must then be entered into the #3-Assignment (Financial Modeling-Startup AB). HIGHLIGHT ALL MODIFIED CELLS within this #3- Assigment (Financial Modeling-Startup AB) in "Yellow". Remember that the cumulative impact from implementing ALL your recommendations must be the creation of a viable financial capital strategy (i.e. a sufficient annual positive cash liquidity balance throughout all five years). Submit these two documents/files cumulatively depicting and justifying an acceptable "Capital Funding Strategy" (i.e. creates positive annual cash balances through implementation of the aforementioned itemized recommendations). # 3-Assignment (Financial Modeling-Startup AB) Financial Statement Analysis Year 2 Year 3 43% Year 4 Year 5 37% Year 1 Gross Margin EBITDA Margin Pre-Tax Margin Return on Equity Revenue/Sales Professional (VP Mktg + Gross Profit/Sales Professional (VP Mktg Revenue/Employee Customers/Salesperson Revenue/Customer Marketing & Sales/Total Operating Exp. Product Development/Total Oper. Exp. Non-Payroll Expenses/ Total Oper. Exp. Payroll Expenses/Total Oper. Exp. Average Employee Salary plus Commiss Current Ratio (Current Assets/Current Liab.) Quick Ratio Long-Term Debt/Equity Ratio Interest Coverage (EBITDA/Interest Expense Bank Debt/EBITDA Operating Exp. Cash Coverage (mths) Cash Runway (mths) (Total Operating Exp. - Gross Profit) Cash Runway @ 50% Scenario (mths) 48% -37% 46% 40% 12% 12% -11% 11% 8% 7% -40% -13% 11% 98% N/A N/A 2046% 62% $1,500,000 $750,000 $312,000 $950,000 $480,000 $393,750 $1,350,000 $648,000 $627,500 $1,517,857 $693,571 $710,882 $1,777,778 $773.333 $850,909 38% 1% 15% 21% 29% 31% 13% 52% 3% 2% 1% 50% 50% 52% 48% 46% 57% 48% 54% 43% $96,000 $91,250 $82,583 $74,294 $69,409 -0.3 -3.4 -2.2 0.7 2.4 3.5 ((Cash + A/R/Current Liab.) -5.6 -2.9 -1.3 -0.2 0.0 0.0 0.0 0.0 0.0 0.0 0.0 0.0 0.0 0.0 0.0 0.0 0.0 0.0 0.0 -5.8 N/A -2.8 -6.4 -3.9 -1.8 -6.5 -32.5 N/A N/A -4.0 -10.7 N/A N/A N/A (Total Operating Exp. - Gross Profit @ 50%) Revenue Growth Rate SG&A Growth Rate Footnotes: N/A 102% 139% 60% 55% N/A 34% 47% 33% 34% adequate gross profit contribution to cover their direct compensation (base salary + sales commissions + payroll taxes + employee benefits) AND contribute to the overall business operating expenses. Ideally, a salesperson at minimum should generate a 3X to 4X ratio, and obviously the higher the better. The VP Marketing/Sales is included because during startup phases they actually sell. 2) Ideally, if the revenue forecast is based upon an "bottoms-up" forecasting methodology, the number of customers will be known. Especially in recurring revenue models, salesperson frequently must continually revisit existing customers. Therefore, a practical ratio of customer per salesperson represents a variable that needs to be monitored. An incredibly efficient way to analyze the underlying staffing levels is to examine the "revenue/employee" ratio and compare to industry benchmarks. It absolutely requires employees to run a business, deliver the product/services, handle all corresponding administrative tasks, etc. Typically during the early phases of a startup business the revenuelemployee will be below industry comparable but should rapidly approach and typically slightly exceed it as the business expands/matures. Additionally, the higher the product/service operating economies of scale the more rapid the potential increase. This is partially why Angels & Venture Capitalist prefer investing in early stage startups with potential strong operating leverage. Service companies typically fall in the $200,000 to $500,000 revenue per employee, whereas a more capital intensive businesses will range in the $600,000 to $1,000,00 revenuelemployee as general "rule of thumb". . - -- - - ---- ****---rr-- ----- absolutely required to support employees. Without the necessary tools, employees cannot effectively perform their jobs. Therefore, an excellent ratio to ensure an acceptable balance is being maintained within the financial projections is to examine the ratio of total non-payroll operating expense line items to total payroll costs. As a general rule, the ratio of PayrolI Expenses to Non-Payroll expenses should never exceed 67%, however this target ratio can vary meaningfully by industry characteristics. and runway. Cash Coverage equals the number of months the business can operate without any revenues at its average monthly operating expense level. This is a worst case type of scenario. The Cash Runway equals the number of months the business can operate at its net average monthly cash "burn-rate", or average gross profits less operating expenses. This is more realistic approach. A minimum acceptable Cash Runway should probably be 3 months, as this is typically the minimum necessary time to raise incremental capital. A typical scenario is to modify the average monthly gross profits to a "50% reduction" in revenues. # 3-Assignment (Financial Modeling-Startup AB) Proforma Cash Flow Statement Year 1 Year 2 Year 3 Year 4 $1,276,590 $85,000 $1,361,590 Year 5 Net Income Plus: Depreciation Operating Cash Flow Working Capital Requirements: Change in Accounts Receivables Change in Inventory Change in Accounts Payable Change in Bank Credit Line Subtotal Working Capital Requirement Investment Capital Requirements: Change in Equipment Change in Furniture & Equipment Subtotal Investment Capital Requirem Funding Sources: Change in Long-term Debt Change in Equity ($620,267) $36,667 ($583,600) ($400,933) $48,333 ($352,600) $534,380 $70,000 $604,380 $2,164,693 $111,667 $2,276,360 ($44,167) ($270,000) $73,875 $0 ($240,292) ($121,667) ($783,333) $207,542 $0 ($697,458) ($184,306) ($886,667) ($1,356,667) $355,698 $0 ($779,614) ($1,185,275) ($126,528) ($33,333) ($200,000) $81,022 $0 ($152,311) $233,580 $0 ($125,000) ($30,000) ($155,000) ($25,000) ($20,000) ($45,000) ($75,000) ($20,000) ($95,000) ($75,000) ($35,000) ($110,000) ($100,000) ($40,000) ($140,000) $0 $500,000 $0 $500,000 ($390,911) $75,000 $0 $0 ($541,173) ($541,173) $409,912 ($1,275,476) ($1,122,647) ($712,735) $0 $0 $0 $0 ($637,892) ($315,911) ($953,803) $0 $0 ($133,595) ($133,595) ($321,673) ($953,803) ($1,275,476) $0 $0 ($319,148) ($319,148) $152,828 Tax Distribution-Members Subtotal Funding Sources Total Cash Flow Beginning Cash Ending Cash Footnotes: ($315,911) ($1,122,647) constructed entirely from the Income Statement and net changes in the Balance Sheet. Therefore contrary to perception, the Cash Flow Statement is actually the easiest projected financial statement to compile, and yet ironically the most important. 2) The "Use of Funds" provided to investors ABSOLUTELY needs to be compared and/or reconciled against the Cash Flow Statement. The Cash Flow Statement clearly identifies the amount of internal cash consumed or generated, working capital demands of the business model, investment demands in longer term capital assets, cash contingency and the means by which these assets are funded (the sources). # 3-Assignment (Financial Modeling-Startup AB) Proforma Balance Sheet Year 2 Beg. $75,000 $10,000 $50,000 $135,000 $0 $5,000 $0 $5,000 $140,000 $0 $0 $0 $0 $0 $150,000 ($10,000) $0 $140,000 $140,000 Year 4 Year 1 ($315,911) $43,333 $250,000 ($22,578) $125,000 $35,000 ($36,667) $123,333 $100,756 $81,022 $0 $81,022 $0 $81,022 $650,000 ($630,267) $0 $19,733 $100,756 Year 3 ($953,803) ($1,275,476) ($1,122,647) $209,167 $1,303,333 $237,024 $225,000 $75,000 ($155,000) $145,000 $382,024 $362,439 $0 $362,439 $0 $362,439 $650,000 ($496,820) ($133,595) $19,585 $382,024 Year 5 ($712,735) $520,000 $3,546,667 $3,353,931 $400,000 $150,000 ($351,667) $198,333 $3,552,265 $951,717 $0 $951,717 $0 $951,717 $650,000 $2,944,463 ($993,916) $2,600,548 $3,552,265 Cash Accounts Receivables $87,500 $520,000 ($346,303) $150,000 $55,000 ($85,000) $120,000 ($226,303) $154,897 $0 $154,897 $0 $154,897 $650,000 ($1,031,200) $0 -$381,200 -$226,303 $335,694 $2,190,000 $1,403,047 $300,000 $110,000 ($240,000) $170,000 $1,573,047 $596,020 $0 $596,020 $0 $596,020 $650,000 $779,770 ($452,743) $977,028 $1,573,047 Inventory Total Current Assets Equipment Office Furniture & Computers Accumulated Depreciation Net PP&E Total Assets Account Payable Bank Credit Line Total Current Liabilities Long-term Debt Total Liabilities Equity Retained Earnings Tax Distribution Total Equity Total Liabilities & Equity Check Balance $0 $0 $0 $0 $0 $0 Footnotes: 1) If the company is a Limited Liability Corporation (LLC), the company is a "pass through" income tax entity, AND does not directly pay income taxes. However, since the individual equity owners of an LLC must pay income taxes on their pro-rata share (individual's % ownership x Pre-tax Income) an LLC will almost always make a cash distribution equal to the aggregate tax income obligation. Therefore, this transaction is only reflected within the Balance Sheet, and effectively is recorded as a equity capital account disbursement (herein line itemed as "Tax Distribution") and a corresponding reduction in cash. 2) ALWAYS maintain a "Check Balance" line item computation, so you will absolutely know your Balance Sheet is in balance. # 3-Assignment (Financial Modeling-Startup AB) Proforma Income Statement Year 2 Year 1 Year 3 Year 4 Year 5 Revenues: Product A Product B Freight/Shipping Revenue Total Revenues $1,500,000 $0 $60,000 $1,560,000 $750,000 $60,000 $0 $750,000 $2,850,000 $150,000 $150,000 $3,150,000 $1,560,000 $150,000 $0 $1,440,000 $6,750,000 $10,625,000 $800,000 $660,000 $12,085,000 $6,570,000 $660,000 $0 $4,855,000 $400,000 $380,000 $7,530,000 $3,910,000 $380,000 $0 $3,240,000 $16,000,000 $1,600,000 $1,120,000 $18,720,000 $10,640,000 $1,120,000 $0 $6,960,000 Cost of Good Sold Freight/Shipping Expenses Sales Commissions Gross Profit Gross Profit Margin 48% 46% 43% 40% 37% Operating (Overhead) Expenses: Salaries $730,000 $233,600 $155,000 $150,000 $72,000 $50,000 $0 $480,000 $153,600 $127,500 $75,000 $0 $175,000 $0 $90,000 $60,00 $37,500 $47,500 $22,500 $35,000 $30,000 $1,333,600 ($583,600) $991,000 $317,120 $255,000 $357,500 $144,000 $50,000 $0 $125,000 $60,000 $65,750 $58,000 $107,250 $55,000 $50,000 $2,635,620 $604,380 $1,263,000 $404,160 $305,000 $571,250 $216,000 $50,000 $0 $125,000 $60,000 $87,125 $105,500 $171,375 $65,000 $70,000 $3,493,410 $1,361,590 $1,527,000 $488,640 $605,000 $880,000| $288,000 $50,000 $0 $125,000 $60,000 $118,000 $113,000 $264,000 $75,000 $90,000 $4,683,640 $2,276,360 12% $111,667 $0 $2,164,693 Employee Taxes & Benefits Marketing Expenses Advertising Expenses Sales Travel Product Development & Testing Product Certification Expenses Internet/Website Expenses Travel Expenses Telephone Expenses Office Rent Insurance Expenses Accounting Legal Total Operating Expenses EBITDA $125,000 $60,000 $45,000 $52,000 $45,000 $45,000 $30,000 $1,792,600 ($352,600) -37% -11% 8% 11% Depreciation Interest Expense Pre-Tax Income $36,667 $0 ($620,267) $48,333 $0 $70,000 $0 $534,380 $85,000 $0 $1,276,590 ($400,933) EBT Profit Margin -40% -13% 7% 11% 12% Footnotes: 1) NO direct financial entries should be inserted within the Income Statement forecast. All listed financial figures MUST be computed from business assumptions contained on the Income Statement Assumption or Balance Sheet Assumptions spreadsheet tab. The forecasted figures on the Income Statement will represent a blend of variable, fixed, and semi-fixed computations against projected business volumes. 2) If multiple meaningful products/services are anticipated, it is recommended to highlight by line iteming each, provided nd.p majority of the Cost of Goods Sold (COGS) or Cost of Sales (COS) line should be variable expenses and therefore move proportionately with changes/modifications in the unit sales/revenue line. It is recommended the COGS/COS line be computed using an estimated unit cost NOT as a direct percentage of revenues, since the sales price point can change over time as well as the unit cost should decline as economies of scale increase. While it can be included within the COGS/COS, as done herein, a variable Sales Commission also be included in the SG&A or Operating Expenses. it does not exceed four. .. y . 4) ALWAYS compute a EBITDA (Earnings Before Income Taxes Depreciation & Amortization) line as this represents the free cash flow internally generated or consumptions within the defined time period. # 3-Assignment (Financial Modeling-Startup AB) Balance Sheet Assumptions Year 1 Year 2 Beginning Balance Sheet: Balances at Time/Year 0 Cash Accounts Receivables Inventory Leasehold Improvements Office Furniture & Computers Accumulated Depreciation Account Payable Bank Credit Line Long-term Debt Equity Retained Earnings Tax Distribution Check Figure Average # Days in Accts. Rec. Average # Days in Inventory-Finished Average # Days in COGS Accts. Payable Average # Days in Operating Expenses Payable Capital Expenditures: Equipment - Warehouse Equipment Depreciation Schedule (in yrs.) Office Equipment Office Furniture & Computers Depr. Sch. (in yrs.) Beg Year 3 Year 4 Year 5 $75,000 $10,000 $50,000 $0 $5,000 $0 $0 $0 $0 $150,000 ($10,000) $0 $0 10 120 30 $125,000 $25,000 $75,000 $75,000 $100,000 $30,000 $20,000 $20,000 $35,000 $40,000 3 Bank Credit Line: Advance Ratio for Accts. Rec. 0% 0% Advance Ratio for Inventory-Finished Interest Rate Equity Capital Raised 0.0% $500,000 $0 $0 $0 $0 Incremental Member Tax Rate Footnotes: 25% 1) In order to compute the Cash Flow Statement, which predominantly reflects changes over time between two Balance Sheets, it is absolutely necessary to have a "Beginning" Balance Sheet. While this can be included on the Balance Sheet spreadsheet tab, I recommend including it within the Balance Sheet Assumptions given that the Beginning Balance Sheet is frequently a near-term forecast and therefore essentially an assumption. 2) Fundamentally within the Balance Sheet there are assumptions that remain relative constant or fixed (such as A/R days, etc.) over the entire horizon and those that must absolutely be reflected within a definitive time period (such as capital fundings/repayments, capital purchases, etc.). # 3-Assignment (Financial Modeling-Startup AB) Income Statement Assumptions Year 1 15,000 $100.00 $50.00 Unit Sales/Revenue Assumptions: Product A Units Sold Unit Price Unit A COGS (Outsourced Mfg.) Product B Units Sold Unit Price Unit COGS Unit Shipping Paid By Customer Unit Shipping Costs To Deliver Staffing Plan/Compensation Assumptions: Year 2 30,000 $95.00 Year 4 125,000 $85.00 Year 5 200,000 $80.00 Year 3 75,000 $90.00 $50.00 7,500 $20.00 $8.00 $4.00 $4.00 Year 2 $50.00 $50.00 $50.00 20,000 $20.00 $8.00 $4.00 40,000 $20.00 $8.00 $4.00 80,000 $20.00 $8.00 $4.00 $4.00 Year 5 $0.00 $0.00 $4.00 $4.00 Year 1 $4.00 Year 3 $4.00 Year 4 Annual Comp. $150,000 President 1.0 1.0 1.0 1.0 1.0 VP Sales & Marketing $120,000 $36,000 $75,000 $100,000 $42,000 $132,000 $75,000 $50.000 1.0 1.0 1.0 1.0 1.0 Shipping Clerks (1:50,000 units) Sales Professionals 1.0 1.0 2.0 4.0 6.0 2.0 4.0 6.0 8.0 CFO/Controller 1.0 1.0 1.0 1.0 Accountants (1:200,000 units) 1.0 1.0 1.0 1.0 2.0 Engineering & Operations IT Manager HR Manager Total # Employees Sales Commission 1.0 1.0 1.0 1.0 1.0 1.0 1.0 1.0 1.0 1.0 5.0 8.0 12.0 17.0 22.0 0.0% Employee Taxes & Benefits 32% Annual Cost of Living Adjustments Marketing and SG&A Expense Assumptions: Sales & Marketing Expenses: 0.0% Year 1 Year 2 Year 3 Year 4 Year 5 # National Trade Shows Cost per Trade Show Marketing Materials 3 6 6 6 6 $17,500 $75,000 $50,000 $150,000 $200,000 5.0% $500,000 Advertising Exp. (% Sales) Travel Expense/Trade Show 5.0% 5.0% 5.0% 5.0% so Monthly Travel Expense/Sales Prof. Development Expenses: Product Development & Testing Regulatory Requirements Web Development & Hosting General & Administrative Expenses: General a Travel Expense/Executive/Month $3,000 $175,000 $50,000 $50,000 $50,000 $50,000 $0 $0 $0 $0 $0 $90,000 $125,000 $125,000 $125,000 $125,000 $2,500 Annual Telephone-Base 800 Service $30,000 Telephone-Variable Warehouse Rent/Year 0.5% $40,000 $40,000 $40,000 $80,000 $80,000 Office Rent/Employee $1,500 0.5% 1.0% Insurance-General (% Rev.) Insurance-Product Liability (% Rev.) Outside Accounting Outside Legal $75,000 $90,000 $35,000 $45,000 $55,000 $65,000 $30,000 $30,000 $50,000 $70,000 Footnotes: 1) Typically, the necessary assumptions to build a forecasted Income Statement are segregated into a "revenue buildup" section, a Cost of Goods Sold (COGS) or Cost of Sales (COS) build up section, an employee "staffing plan", and SG&A or Operating Expense line item related. The underlying baseline assumptions will be a blend of variable, fixed, and semi-fixed factors. 2) Employee compensation predominantly is a major proportion of total expenses, therefore a detailed staffing plan which includes salaries, payroll taxes, commissions, bonus plans, benefits, etc. is a mandatory requirement. Within the staffing plan employee headcounts will range from fixed (executives), to variable (direct production), and semi-variable (sales personnel). 3) SG&A or Operating Expenses will absolutely range from fixed to variable and semi-fixed in between. The Financial Modeling needs to effectively model all the aforementioned.
Expert Answer:
Answer rating: 100% (QA)
Capital funding is the money that lenders and equity holders provide to a business for daily and longterm needs A companys capital funding consists of both debt bonds and equity stock The business use... View the full answer

Related Book For 

Intermediate Accounting
ISBN: 978-0324300987
10th Edition
Authors: Loren A Nikolai, D. Bazley and Jefferson P. Jones
Posted Date:
Students also viewed these accounting questions
-
In its first two years of operations, GraNOLa Corporation reports a net operating loss (NOL) of $500,000 for 2021 and taxable income of $70,000 before any NOL carryforward for 2022. GraNOLa has a 25%...
-
The table below shows the number of state-registered automatic weapons and the murder rate for several Northwestern states.. I 31 11.5 13.6 I thousands of automatic weapons y murders per 100,000...
-
Golden Dragon Ltd. begins operations in Vancouver on September 1, 2015. These operations include an elegant sit down restaurant specializing in northern Chinese cuisine, as well as a take out...
-
The following data represent the amount of time (in minutes) a random sample of eight students took to complete the online portion of an exam in Sullivan's Statistics course. Compute the mean,...
-
Examples 1, 3, and 5 referred to a study about astrology. Another part of the study used the following experiment: Professional astrologers prepared horoscopes for 83 adults. Each adult was shown...
-
For the current-to-voltage converter circuit in Figure P12.30, the parameters are as described in Problem 12.30. If \(R_{i}=10 \mathrm{k} \Omega\), determine the closedloop input resistance \(R_{i...
-
Suppose Frazier Corporation has receivables of \($63,000\), furniture totaling \($198,000\), and cash of \($45,000\). The business has a \($108,000\) note payable and owes \($84,000\) on account. How...
-
The weighted average cost of capital for a firm (assuming all three Modigliani and Miller assumptions apply) is 15 percent. What is the current cost of equity capital for the firm if its cost of debt...
-
A business is thinking about an investment of $28,000,000 (purchase price) in new equipment to replace older equipment with a book value of $12,000,000 and a market value of $20,000,000. If the...
-
At a local university, the Student Commission on Programming and Entertainment (SCOPE) is preparing to host its first rock concert of the school year. To successfully produce this rock concert, SCOPE...
-
Sarah owns some farms in South England. She grows potatoes, cabbage, onions, and cucumber in her farms. The land that is used for potatoes and cabbage can be used for either crop but cannot be used...
-
The British Broadcasting Corporation (BBC) recently announced the cancellation of a major Information Technology(IT) project intended to update their vast broadcast operations. The project, called...
-
Using your favorite search engine (Google, Yahoo!, etc.), type in the keywords project and project management. Randomly select three of the links that come up on the screen. Summarize what you find.
-
Evaluate the difference between direct and indirect costs when considering a project budget. What other common project costs can you identify?
-
Describe some of the benefits of developing budget contingencies for projects. Is it advantageous for project managers to apply contingency to every project? Justify your answer.
-
What are the main benefits of constructing a network diagram for a project? Why is it a useful project management tool?
-
Find an eBusiness with an unfriendly user interface design. Explain what exactly is wrong, what fundamental design principles have been ignored or violated. Suggest how to re-design it. Support your...
-
Tarick Toys Company manufactures video game consoles and accounts for product costs using process costing. The following information is available regarding its June inventories. The following...
-
For the past five years, Herbert has maintained an investment (properly accounted for and reported upon) in Broome amounting to a 10% interest in the voting common stock of Broome. The purchase price...
-
As the auditor of the Hayes Company for the year ended December 31, 2007, you found the following transactions occurred near its closing date: 1. Merchandise received on January 8, 2008, and costing...
-
In auditing the Train Company, you obtain directly from the bank Trains bank statement, canceled checks, and other memoranda which relate to the companys bank account for December 2007. In...
-
Use the properties of the mean and median to determine which are the correct mean and median for the following histogram. (i) Mean is 3.0; median is 4.1 (ii) Mean is 4.2; median is 3.2 (iii) Mean is...
-
In a study of Facebook users conducted by the Pew Research Center, the mean number of Facebook friends per user was 245 and the median was 111. If a histogram were constructed for the numbers of...
-
The National Center for Health Statistics reported in a recent year that the mean height for U.S. women aged 2029 was 64.3 inches, and the median was 64.2 inches. If a histogram were constructed for...

Study smarter with the SolutionInn App