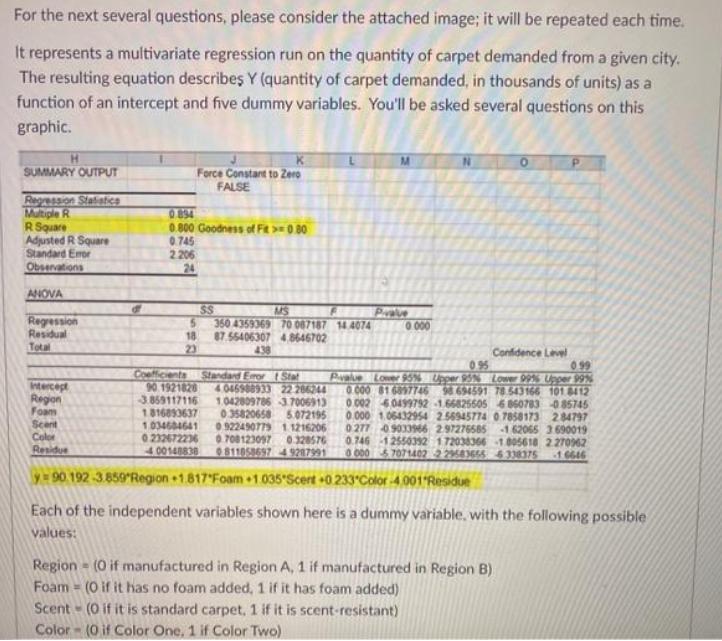
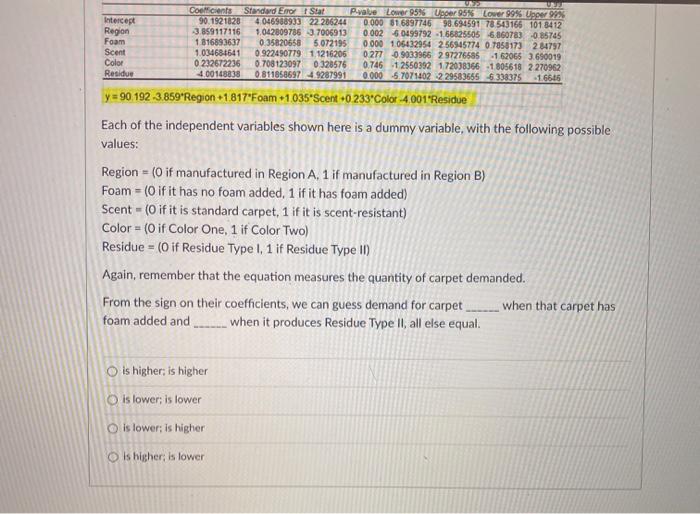
For the next several questions, please consider the attached image; it will be repeated each time....
Fantastic news! We've Found the answer you've been seeking!
Question:
Transcribed Image Text:
For the next several questions, please consider the attached image; it will be repeated each time. It represents a multivariate regression run on the quantity of carpet demanded from a given city. The resulting equation describeş Y (quantity of carpet demanded, in thousands of units) as a function of an intercept and five dummy variables. You ll be asked several questions on this graphic. H SUMMARY OUTPUT Regression Statistics Multiple R R Square Adjusted R Square Standard Emor Observations ANOVA Regression Residual Total Intercept Region Foam Scent Color Residue Force Constant to Zero FALSE 0.894 0.800 Goodness of Fit >=0.80 0.745 2.206 24 5 18 23 $$ MS 350 4359369 70 087187 14.4074 87.55406307 4.8646702 438 Palve 0.000 Confidence Level 0.95 0.99 Coefficients Standard Errort Stat Pivalue Lower 95% Upper 95% Lower 99% Upper 99% 90 1921828 4.046988933 22 206244 0.000 816897746 98 694591 78.543166 101.8412 -3.859117116 1.042809786 3.7006913 0.002 0499792 -1.668255605 6860783 0 85745 1816893637 0.35820658 5.072195 0.000 1.06432954 2.56945774 0.7858173 2.84797 1.034604641 0.922490779 1.1216206 0277 09033966 2.97276565 -1 62065 3 690019 0232672236 0.708123097 0.328576 0.746 12550392 172038366 -1.005618 2.270962 -4.00148838 0811058697 49287991 0 000 67071402 229583655 4338375 -1.6646 y=90.192-3.859 Region +1.817 Foam +1.035 Scert +0.233 Color-4.001 Residue Each of the independent variables shown here is a dummy variable, with the following possible values: Region - (0 if manufactured in Region A, 1 if manufactured in Region B) Foam (0 if it has no foam added, 1 if it has foam added) Scent (0 if it is standard carpet, 1 if it is scent-resistant) M Color- (0 if Color One, 1 if Color Two) Intercept Region Foam Scent Color Residue Coefficients Standard Emort Stat 90.1921828 4.046988933 22.206244 3.859117116 1.042809786 3.7006913 1.816893637 0.35820658 5.072195 1.034684641 0.922490779 1.1216206 0232672236 0.708123097 0.328576 4.00148838 08118586974 9287991 y=90.192-3.859 Region +1.817 Foam +1.035 Scent +0.233 Color -4.001 Residue 992 P-value Lower 95% Upper 95% Lover 99% Upper 99% 0.000 81.6897746 98.694591 78.543166 101 8412 0.002 60499792 -1.66825505 6.860783 -0.85745 0.000 1.06432954 2.56945774 0.7858173 2.84797 0.277 0.9033966 2.97276685 -1 62065 3.690019 0.746 -1.2550392 1.72038366 -1.805618 2270962 0.000 5.7071402 -2 29583655 6338375 -1.6646 Each of the independent variables shown here is a dummy variable, with the following possible values: Region = (0 if manufactured in Region A, 1 if manufactured in Region B) Foam (0 if it has no foam added, 1 if it has foam added) Scent Color (0 if Color One, 1 if Color Two) Residue = (0 if Residue Type I, 1 if Residue Type II) Again, remember that the equation measures the quantity of carpet demanded. From the sign on their coefficients, we can guess demand for carpet. foam added and when it produces Residue Type II, all else equal. = (0 if it is standard carpet, 1 if it is scent-resistant) O is higher; is higher O is lower; is lower O is lower; is higher O is higher; is lower when that carpet has For the next several questions, please consider the attached image; it will be repeated each time. It represents a multivariate regression run on the quantity of carpet demanded from a given city. The resulting equation describeş Y (quantity of carpet demanded, in thousands of units) as a function of an intercept and five dummy variables. You ll be asked several questions on this graphic. H SUMMARY OUTPUT Regression Statistics Multiple R R Square Adjusted R Square Standard Emor Observations ANOVA Regression Residual Total Intercept Region Foam Scent Color Residue Force Constant to Zero FALSE 0.894 0.800 Goodness of Fit >=0.80 0.745 2.206 24 5 18 23 $$ MS 350 4359369 70 087187 14.4074 87.55406307 4.8646702 438 Palve 0.000 Confidence Level 0.95 0.99 Coefficients Standard Errort Stat Pivalue Lower 95% Upper 95% Lower 99% Upper 99% 90 1921828 4.046988933 22 206244 0.000 816897746 98 694591 78.543166 101.8412 -3.859117116 1.042809786 3.7006913 0.002 0499792 -1.668255605 6860783 0 85745 1816893637 0.35820658 5.072195 0.000 1.06432954 2.56945774 0.7858173 2.84797 1.034604641 0.922490779 1.1216206 0277 09033966 2.97276565 -1 62065 3 690019 0232672236 0.708123097 0.328576 0.746 12550392 172038366 -1.005618 2.270962 -4.00148838 0811058697 49287991 0 000 67071402 229583655 4338375 -1.6646 y=90.192-3.859 Region +1.817 Foam +1.035 Scert +0.233 Color-4.001 Residue Each of the independent variables shown here is a dummy variable, with the following possible values: Region - (0 if manufactured in Region A, 1 if manufactured in Region B) Foam (0 if it has no foam added, 1 if it has foam added) Scent (0 if it is standard carpet, 1 if it is scent-resistant) M Color- (0 if Color One, 1 if Color Two) Intercept Region Foam Scent Color Residue Coefficients Standard Emort Stat 90.1921828 4.046988933 22.206244 3.859117116 1.042809786 3.7006913 1.816893637 0.35820658 5.072195 1.034684641 0.922490779 1.1216206 0232672236 0.708123097 0.328576 4.00148838 08118586974 9287991 y=90.192-3.859 Region +1.817 Foam +1.035 Scent +0.233 Color -4.001 Residue 992 P-value Lower 95% Upper 95% Lover 99% Upper 99% 0.000 81.6897746 98.694591 78.543166 101 8412 0.002 60499792 -1.66825505 6.860783 -0.85745 0.000 1.06432954 2.56945774 0.7858173 2.84797 0.277 0.9033966 2.97276685 -1 62065 3.690019 0.746 -1.2550392 1.72038366 -1.805618 2270962 0.000 5.7071402 -2 29583655 6338375 -1.6646 Each of the independent variables shown here is a dummy variable, with the following possible values: Region = (0 if manufactured in Region A, 1 if manufactured in Region B) Foam (0 if it has no foam added, 1 if it has foam added) Scent Color (0 if Color One, 1 if Color Two) Residue = (0 if Residue Type I, 1 if Residue Type II) Again, remember that the equation measures the quantity of carpet demanded. From the sign on their coefficients, we can guess demand for carpet. foam added and when it produces Residue Type II, all else equal. = (0 if it is standard carpet, 1 if it is scent-resistant) O is higher; is higher O is lower; is lower O is lower; is higher O is higher; is lower when that carpet has
Expert Answer:
Answer rating: 100% (QA)
From the sign on their coefficients we can guess demand for carpet when that carpet has foam added a... View the full answer
Related Book For
Business Communication Essentials a skill based approach
ISBN: 978-0132971324
6th edition
Authors: Courtland L. Bovee, John V. Thill
Posted Date:
Students also viewed these finance questions
-
For the next several days, take notes on your listening performance during at least a half-dozen situations in class, during social activities, and at work, if applicable. Referring to the traits of...
-
For the next several questions, consider a file called readme.txt that has the following contents: What would be the output from the following code when it is run on the readme.txt file? 6.7 This...
-
Accounting Instructions: Attached is a spreadsheet with several years of financial reporting data from Sears. Review the income statemen
-
Susan has completed a concept map, assisted by her colleagues, and has recently returned from her meeting with her manager. Her manager is very concerned about the high attrition rate and poor...
-
Determine the specific volume of superheated water vapor at 15 MPa and 350oC, using (a) The ideal-gas equation, (b) The generalized compressibility chart, and (c) The steam tables. Also determine the...
-
Continuing the idea of Exercise 7, what would be an easy way to answer a question asking you to define C n (X), n : C n (X) C n-1 (X), Z n (X), and B n (X) for a simplicial complex X perhaps...
-
Innovative Computers Pty Ltd produces laptops. Each laptop contains a rechargeable battery and LCD screen. Batteries and screens are purchased from an outside supplier for \($192\) and \($300\) each,...
-
Tom, Dick, and Harry constitutes the entire market for scrod. Toms demand curve is given by Q1 = 100 2P For P 50. For P > 50, Q1 = 0. Dicks demand curve is given by Q2 = 160 4P For P 40. For P >...
-
137- We want to use K-Means with K=2 for the following data. Where should we initially place the cluster centers? Subject A B 1 1.0 1.0 2 1.5 2.0 34 3 3.0 4.0 4 5.0 7.0 5 3.5 5.0 19 6 4.5 5.0 7 3.5...
-
You designed the new database for City Jail. Now you need to create all the tables for the database. First, create all the tables using the information outlined in Section A. Second, make the...
-
Study the WBS and Gantt charts provided in Figures 3-3 and 3-4. Enter the WBS into Project, indenting tasks as shown to create the WBS hierarchy. Do not enter durations or dependencies. Print the...
-
You are to enter up the necessary accounts for the month of October from the following information relating to a small printing firm. Then balance-off the accounts and extract a trial balance as at...
-
Enter the following transactions in personal accounts only. Bring down the balances at the end of the month. After completing this, state which of the balances represent debtors and which represent...
-
Redraft each of the accounts given in your answer to Review Question 5.6A in three-column Style. Data From Question 5.6A Enter the following transactions in personal accounts only. Bring down the...
-
Redraft each of the accounts given in your answer to Review Question 5.2 in three-column style. 2016 June 1 Purchases on time from J. Wilson 240; P. Todd 390; J. Fry 1,620. 3 Purchases on time from...
-
Enter the following in the personal accounts (i.e. the creditor and debtor accounts) only. Do not write up the other accounts. Balance-off each personal account at the end of the month. After...
-
A. Select any of the company from the list provided below and explain the following based on Ethical Leadership: Companies: 1. Apple 2. Walmart 3. Berkshire Hathaway 4. Toyota 5. Royal Dutch Shell...
-
Construct a 4 x 25 design confounded in two blocks of 16 observations each. Outline the analysis of variance for this design.
-
Does the three-step writing process apply to IM? Why or why not?
-
Use what you know about sales messages to analyze the flaws in this promotional brochure. Then use the steps that follow to produce a better version. We are pleased to announce that Scruba Dub has...
-
Your company is the largest private employer in your metropolitan area, and the 43,500 employees in your workforce have a tremendous impact on local traffic. A group of city and county transportation...
-
The hydrodynamic boundary layer equations consist of one momentum equation and the continuity equation. How does one solve for the pressure?
-
In laminar flow, why does the heat transfer coefficient decrease as the boundary layer thickness grows?
-
How does the hydrodynamic boundary layer thickness depend upon the Reynolds number?
Study smarter with the SolutionInn App