

? ? You are the loans manager at a local bank. Two companies have approached you about
Fantastic news! We've Found the answer you've been seeking!
Question:

 ?
?
Transcribed Image Text:
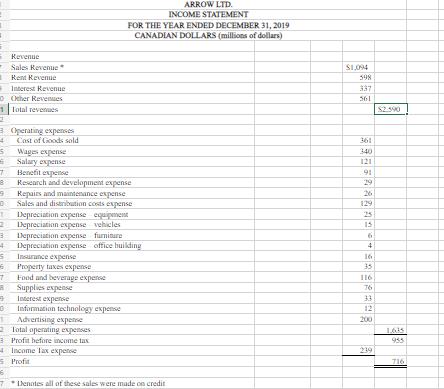
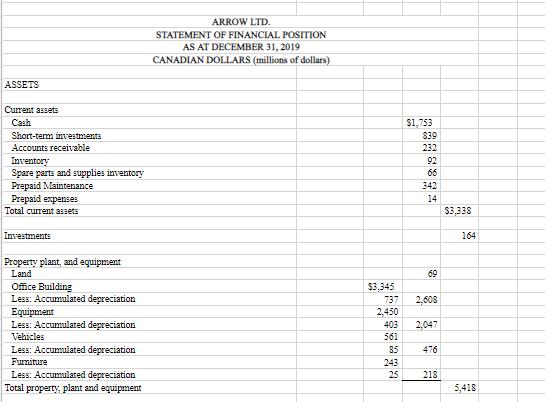
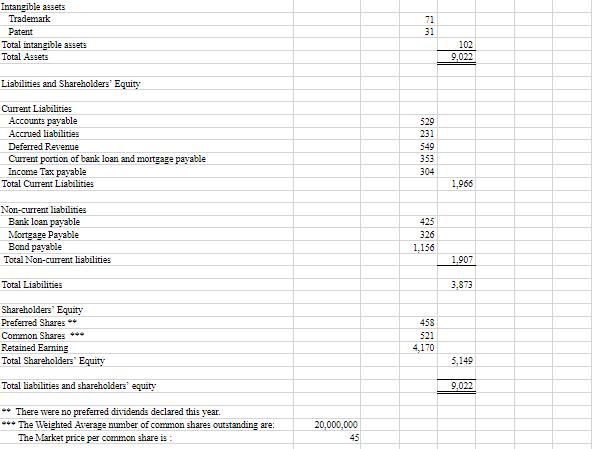
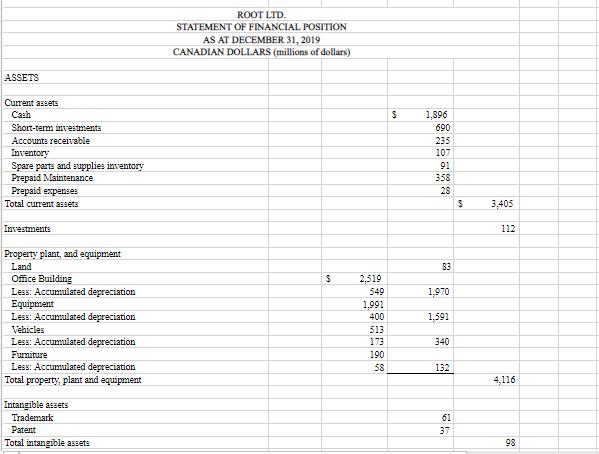
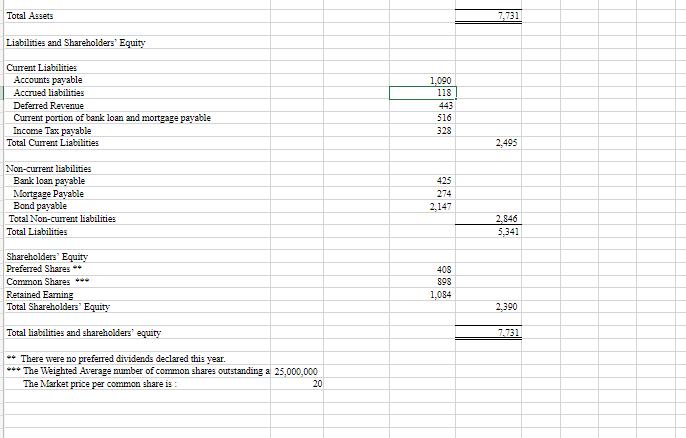
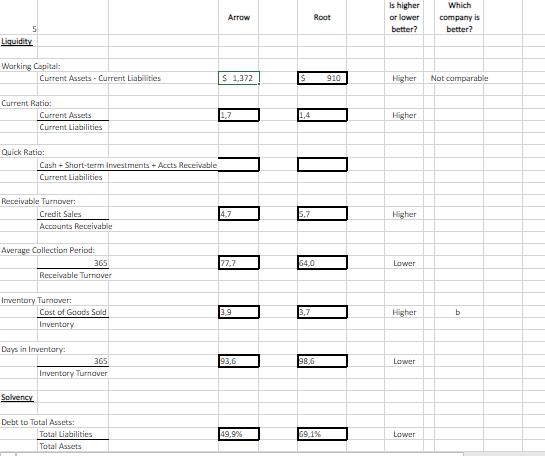
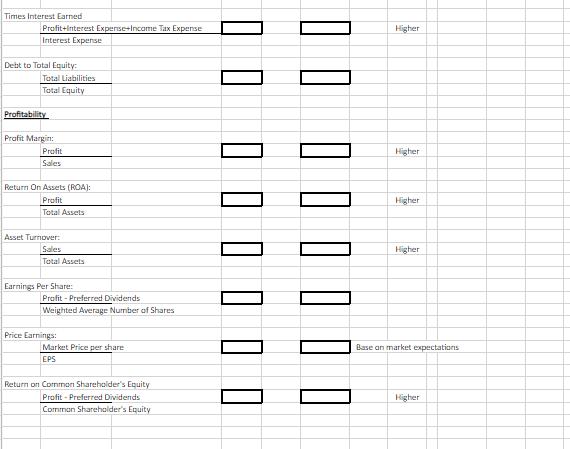
You are the loans manager at a local bank. Two companies have approached you about securing a 6-month loan. Based on your calculations in the Microsoft Excel file provided to you by your instructor, please comment on the following: Assess and comment on the LIQUIDITY ratios you calculated: (1 mark) Assess and comment on the SOLVENCY ratios you calculated: (1 mark) Assess and comment on the PROFITABILITY ratios you calculated__(1 mark) Which company would you prefer to give the loan to between Root and Arrow? Explain why. (1 mark) In 2-3 sentences, describe the concern you would have if you found out that Arrow had upgraded its accounting system this year and the company did not test the new accounting system to make sure the system was processing data correctly? (1 mark) Revenue Sales Revenue Rent Revenue Interest Revenue 0 Other Revenues 1 Total revenues H 4 5 S 7. 8 9 D $ 6 7 Operating expenses Cost of Goods sold 1 Depreciation expense equipment 2 Depreciation expense vehicles 3 4 9 Wages expense Salary expense Benefit expense 0 Research and development expense Repairs and maintenance expense Sales and distribution costs expense Food and beverage expense Supplies expense Interest expense Information technology expense Advertising expense Total operating expenses 3 Profit before income tax Income Tax expense Profit FOR THE YEAR ENDED DECEMBER 31, 2019 CANADIAN DOLLARS (millions of dollars) Depreciation expense furniture Depreciation expense office building Insurance expense Property taxes expense ARROW LTD. INCOME STATEMENT Denotes all of these sales were made on credit $1,094 598 337 561 361 340 121 91 29 26 25 15 6 4 16 35 116 76 33 12 200 239 $2.590 1635 955 716 ASSETS Current assets Cash Short-term investments Accounts receivable Inventory Spare parts and supplies inventory Prepaid Maintenance. Prepaid expenses Total current assets Investments Property plant, and equipment Land Office Building Less: Accumulated depreciation Equipment Less: Accumulated depreciation Vehicles Less: Accumulated depreciation Furniture Less: Accumulated depreciation Total property, plant and equipment ARROW LTD. STATEMENT OF FINANCIAL POSITION AS AT DECEMBER 31, 2019 CANADIAN DOLLARS (millions of dollars) $3,345 2,450 403 561 85 $1,753 737 2,608 243 25 839 232 92 66 342 14 69 2,047 476 218 $3,338 164 5,418 Intangible assets Trademark Patent Total intangible assets Total Assets Liabilities and Shareholders' Equity Current Liabilities Accounts payable Accrued liabilities Deferred Revenue Current portion of bank loan and mortgage payable Income Tax payable Total Current Liabilities Non-current liabilities Bank loan payable Mortgage Payable Bond payable Total Non-current liabilities Total Liabilities Shareholders Equity Preferred Shares ** Common Shares *** Retained Earning Total Shareholders' Equity Total liabilities and shareholders' equity **There were no preferred dividends declared this year. *** The Weighted Average number of common shares outstanding are: The Market price per common share is: 20,000,000 45 71 31 529 231 549 353 304 425 326 1,156 458 521 4,170 102 9,022 1,966 1,907 3,873 5,149 9,022 Revenue Sales Revenue Rent Revenue Interest Revenue Other Revenues Total revenues Operating expenses Cast of Goods sold Wages expense Salary expense Benefit expense Research and development expense Repairs and maintenance expense Sales and distribution costs expense Depreciation expense equipment Depreciation expense vehicles Depreciation expense furniture Depreciation expense office building Insurance expense Property taxes expense Food and beverage expense Supplies expense Interest expense Information technology expense Advertising expense Total operating expenses Profit before income tax Income Tax expense Profit ROOT LTD. INCOME STATEMENT FOR THE YEAR ENDED DECEMBER 31, 2019 CANADIAN DOLLARS (millions of dollars) *Denotes all of these sales were made on credit S 1,342 556 197 12 389254-58-588358 119 170 137 10 119 76 S 2,107 1855 252 176 ASSETS Current assets Cash Short-term investments Accounts receivable Inventory Spare parts and supplies inventory Prepaid Maintenance Prepaid expenses Total current assets Investments Property plant, and equipment Land Office Building Less: Accumulated depreciation Equipment Less: Accumulated depreciation Vehicles Less: Accumulated depreciation Furniture Less: Accumulated depreciation Total property, plant and equipment Intangible assets Trademark Patent Total intangible assets ROOT LTD. STATEMENT OF FINANCIAL POSITION AS AT DECEMBER 31, 2019 CANADIAN DOLLARS (millions of dollars) S 2,519 549 1,991 400 513 173 190 58 10 $ 1,896 690 235 107 91 358 28 83 1,970 1,591 340 132 61 37 $ 3,405 112 4,116 98 Total Assets Liabilities and Shareholders' Equity Current Liabilities Accounts payable Accrued liabilities Deferred Revenue Current portion of bank loan and mortgage payable Income Tax payable Total Current Liabilities Non-current liabilities Bank loan payable Mortgage Payable Bond payable Total Non-current liabilities Total Liabilities Shareholders' Equity Preferred Shares ** Common Shares *** Retained Earning Total Shareholders' Equity Total liabilities and shareholders' equity ** There were no preferred dividends declared this year. ***The Weighted Average number of common shares outstanding a 25,000,000 The Market price per common share is: 20 1,090 118 443 516 328 425 274 2,147 408 898 1,084 7,731 2,495 2,846 5,341 2,390 7.731 Liquidity Working Capital: Current Assets - Current Liabilities Current Ratio: Current Assets Current Liabilities Quick Ratio: Cash + Short-term Investments + Accts Receivable Current Liabilities Receivable Turnover: Credit Sales Accounts Receivable Average Collection Period: Solvency 365 Receivable Turnover Inventory Turnover: Cost of Goods Sold Inventory Days in Inventory: 365 Inventory Turnover Debt to Total Assets: Total Liabilities Total Assets Arrow $ 1,372 1,7 4,7 77,7 3.9 93,6 49,9% $ 910 1,4 5,7 Root 64,0 3,7 98,6 59,1% Is higher or lower better? Higher Not comparable Higher Higher Lower Higher Lower Which company is better? Lower b Times Interest Earned Profit+Interest Expense+Income Tax Expense Interest Expense Debt to Total Equity: Total Liabilities Total Equity Profitability Profit Margin: Profit Sales Return On Assets (ROA): Profit Total Assets Asset Turnover: Sales Total Assets Earnings Per Share: Profit-Preferred Dividends Weighted Average Number of Shares Price Earnings: Market Price per share EPS Return on Common Shareholder's Equity Profit-Preferred Dividends Comman Shareholder's Equity 0 000000 Higher Higher Higher Higher Base an market expectations Higher You are the loans manager at a local bank. Two companies have approached you about securing a 6-month loan. Based on your calculations in the Microsoft Excel file provided to you by your instructor, please comment on the following: Assess and comment on the LIQUIDITY ratios you calculated: (1 mark) Assess and comment on the SOLVENCY ratios you calculated: (1 mark) Assess and comment on the PROFITABILITY ratios you calculated__(1 mark) Which company would you prefer to give the loan to between Root and Arrow? Explain why. (1 mark) In 2-3 sentences, describe the concern you would have if you found out that Arrow had upgraded its accounting system this year and the company did not test the new accounting system to make sure the system was processing data correctly? (1 mark) Revenue Sales Revenue Rent Revenue Interest Revenue 0 Other Revenues 1 Total revenues H 4 5 S 7. 8 9 D $ 6 7 Operating expenses Cost of Goods sold 1 Depreciation expense equipment 2 Depreciation expense vehicles 3 4 9 Wages expense Salary expense Benefit expense 0 Research and development expense Repairs and maintenance expense Sales and distribution costs expense Food and beverage expense Supplies expense Interest expense Information technology expense Advertising expense Total operating expenses 3 Profit before income tax Income Tax expense Profit FOR THE YEAR ENDED DECEMBER 31, 2019 CANADIAN DOLLARS (millions of dollars) Depreciation expense furniture Depreciation expense office building Insurance expense Property taxes expense ARROW LTD. INCOME STATEMENT Denotes all of these sales were made on credit $1,094 598 337 561 361 340 121 91 29 26 25 15 6 4 16 35 116 76 33 12 200 239 $2.590 1635 955 716 ASSETS Current assets Cash Short-term investments Accounts receivable Inventory Spare parts and supplies inventory Prepaid Maintenance. Prepaid expenses Total current assets Investments Property plant, and equipment Land Office Building Less: Accumulated depreciation Equipment Less: Accumulated depreciation Vehicles Less: Accumulated depreciation Furniture Less: Accumulated depreciation Total property, plant and equipment ARROW LTD. STATEMENT OF FINANCIAL POSITION AS AT DECEMBER 31, 2019 CANADIAN DOLLARS (millions of dollars) $3,345 2,450 403 561 85 $1,753 737 2,608 243 25 839 232 92 66 342 14 69 2,047 476 218 $3,338 164 5,418 Intangible assets Trademark Patent Total intangible assets Total Assets Liabilities and Shareholders' Equity Current Liabilities Accounts payable Accrued liabilities Deferred Revenue Current portion of bank loan and mortgage payable Income Tax payable Total Current Liabilities Non-current liabilities Bank loan payable Mortgage Payable Bond payable Total Non-current liabilities Total Liabilities Shareholders Equity Preferred Shares ** Common Shares *** Retained Earning Total Shareholders' Equity Total liabilities and shareholders' equity **There were no preferred dividends declared this year. *** The Weighted Average number of common shares outstanding are: The Market price per common share is: 20,000,000 45 71 31 529 231 549 353 304 425 326 1,156 458 521 4,170 102 9,022 1,966 1,907 3,873 5,149 9,022 Revenue Sales Revenue Rent Revenue Interest Revenue Other Revenues Total revenues Operating expenses Cast of Goods sold Wages expense Salary expense Benefit expense Research and development expense Repairs and maintenance expense Sales and distribution costs expense Depreciation expense equipment Depreciation expense vehicles Depreciation expense furniture Depreciation expense office building Insurance expense Property taxes expense Food and beverage expense Supplies expense Interest expense Information technology expense Advertising expense Total operating expenses Profit before income tax Income Tax expense Profit ROOT LTD. INCOME STATEMENT FOR THE YEAR ENDED DECEMBER 31, 2019 CANADIAN DOLLARS (millions of dollars) *Denotes all of these sales were made on credit S 1,342 556 197 12 389254-58-588358 119 170 137 10 119 76 S 2,107 1855 252 176 ASSETS Current assets Cash Short-term investments Accounts receivable Inventory Spare parts and supplies inventory Prepaid Maintenance Prepaid expenses Total current assets Investments Property plant, and equipment Land Office Building Less: Accumulated depreciation Equipment Less: Accumulated depreciation Vehicles Less: Accumulated depreciation Furniture Less: Accumulated depreciation Total property, plant and equipment Intangible assets Trademark Patent Total intangible assets ROOT LTD. STATEMENT OF FINANCIAL POSITION AS AT DECEMBER 31, 2019 CANADIAN DOLLARS (millions of dollars) S 2,519 549 1,991 400 513 173 190 58 10 $ 1,896 690 235 107 91 358 28 83 1,970 1,591 340 132 61 37 $ 3,405 112 4,116 98 Total Assets Liabilities and Shareholders' Equity Current Liabilities Accounts payable Accrued liabilities Deferred Revenue Current portion of bank loan and mortgage payable Income Tax payable Total Current Liabilities Non-current liabilities Bank loan payable Mortgage Payable Bond payable Total Non-current liabilities Total Liabilities Shareholders' Equity Preferred Shares ** Common Shares *** Retained Earning Total Shareholders' Equity Total liabilities and shareholders' equity ** There were no preferred dividends declared this year. ***The Weighted Average number of common shares outstanding a 25,000,000 The Market price per common share is: 20 1,090 118 443 516 328 425 274 2,147 408 898 1,084 7,731 2,495 2,846 5,341 2,390 7.731 Liquidity Working Capital: Current Assets - Current Liabilities Current Ratio: Current Assets Current Liabilities Quick Ratio: Cash + Short-term Investments + Accts Receivable Current Liabilities Receivable Turnover: Credit Sales Accounts Receivable Average Collection Period: Solvency 365 Receivable Turnover Inventory Turnover: Cost of Goods Sold Inventory Days in Inventory: 365 Inventory Turnover Debt to Total Assets: Total Liabilities Total Assets Arrow $ 1,372 1,7 4,7 77,7 3.9 93,6 49,9% $ 910 1,4 5,7 Root 64,0 3,7 98,6 59,1% Is higher or lower better? Higher Not comparable Higher Higher Lower Higher Lower Which company is better? Lower b Times Interest Earned Profit+Interest Expense+Income Tax Expense Interest Expense Debt to Total Equity: Total Liabilities Total Equity Profitability Profit Margin: Profit Sales Return On Assets (ROA): Profit Total Assets Asset Turnover: Sales Total Assets Earnings Per Share: Profit-Preferred Dividends Weighted Average Number of Shares Price Earnings: Market Price per share EPS Return on Common Shareholder's Equity Profit-Preferred Dividends Comman Shareholder's Equity 0 000000 Higher Higher Higher Higher Base an market expectations Higher
Expert Answer:
Answer rating: 100% (QA)
Is Higher or Lower Which Company Arrow Root Working Capit... View the full answer

Related Book For 
The Future of Business
ISBN: 978-0176570255
5th edition
Authors: Norm Althouse, Laura Allan, Christopher Hartt
Posted Date:
Students also viewed these accounting questions
-
Below is a partially completed income statement and statement of owner's equity for Gary Dickson Engineering Company. Instructions Fill in the missing amounts. Consulting revenue $18,000 Advertising...
-
1. Construct an income statement and statement of financial position for Suncor from the information in the case. 2. What is its debt-to-equity ratio? Do some Internet research and compare Suncor...
-
Skreenz-N-Things [SNT] manufactures and sells high-quality digital products. One of the popular products is a commercial cloud-based digital storage unit called Storit which sells for $5,100 per unit...
-
1. The following are selected accounts taken from the adjusted trial balances of the Purell Merchandise company on December 31, 2021: Inventory, January 1, 2021 Selling expenses Loss on sale of...
-
Jane was due to make loan payments of $1200 six months ago, $1500 one month ago, and $700 in two months. Instead, she is to make a single payment today. If money is worth 9.8% and the agreed focal...
-
You may not think about what is in your favorite candy bar or bag of chips, but the Fair Packaging and Labeling Act enacted more than 35 years ago regulates how consumer commodities are labeled,...
-
The distribution of the ages of the winners of the Tour de France from 1903 to 2016 is approximately bell-shaped. The mean age is 27.9 years, with a standard deviation of 3.3 years. Use the...
-
For each of the following independent situations, determine the appropriate accounting method to be used: cost or equity. For cost method situations, determine whether the security should be...
-
What is the output of running class C? class A { public A() { System.out.println("The default constructor of A is invoked"); } } class B extends A { public B() { System.out.println("The default...
-
20. What is the IPv6 address of the computer making the DNS AAAA request? This is the source address of the 20th packet in the trace. Give the IPv6 source address for this datagram in the exact same...
-
Image credit:Remko van Dokkum For this assignment I would like you to explore Video Case 10: GoPro: Making All of Us Heroes with Exciting New Products. This case study is located on pages 296-298 of...
-
Describe the properties of a good instrumental variable.
-
Give an intuitive explanation of why correlation between a random \(x\) and the error term causes the least squares estimator to be inconsistent.
-
Discuss how the method of moments can be used to derive the least squares and instrumental variables estimators, paying particular attention to the assumptions upon which the derivations are based.
-
When using \(N=50\) observations to estimate the model \(y_{i}=\beta_{1}+\beta_{2} x_{i}+\beta_{3} z_{i}+e_{i}\), you obtain \(S S E=2132.65\) and \(s_{y}=9.8355\). a. Find \(R^{2}\). b. Find the...
-
Describe the "errors-in-variables" problem in econometrics and its consequences for the least squares estimator.
-
The year end for a sole trader is 3 0 November 2 0 X 7 . The business pays for its gas by a standing order of 2 0 0 per month. On 1 December 2 0 X 6 , the statement from the gas supplier showed that...
-
A local politician is concerned that a program for the homeless in her city is discriminating against blacks and other minorities. The following data were taken from a random sample of black and...
-
Discuss some ways of improving production and operations.
-
What are some of the considerations when choosing a form of business ownership to ensure that it suits your needs?
-
Discuss the trends in human resource management.
-
Political scientists are interested in knowing what factors affect voter turnout in elections. One such factor is the unemployment rate. Data collected in presidential election years since 1964 show...
-
You are the manager of a large department store. Over the years, youve found a strong correlation between your September sales and the number of employees youll need to hire for peak efficiency...
-
Youve been hired by your colleges alumni association to research how past contributions were associated with alumni income and years that have passed since graduation. It is found that R 2 = 0.36....

Study smarter with the SolutionInn App