

Question: a) obtain the data & plot the time series of these two variables between January 1990 to December 2020. Both variables can be found
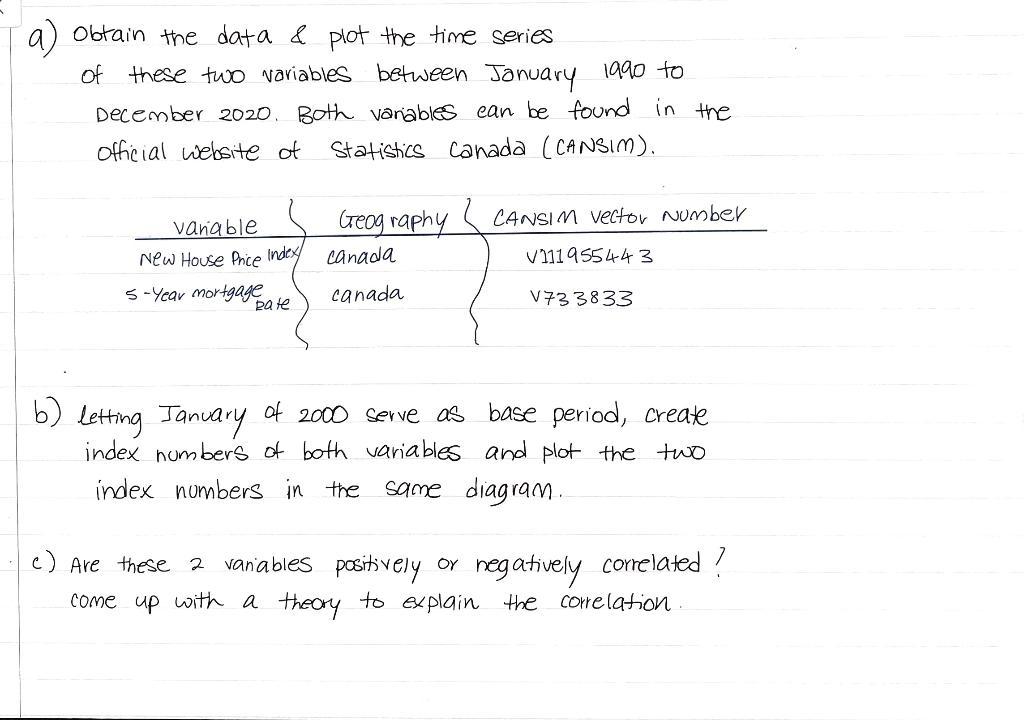
a) obtain the data & plot the time series of these two variables between January 1990 to December 2020. Both variables can be found in the official website of Statistics Canada (CANSIM). vanable. New House Price Index/ 5-Year mortgage pate Geography CANSIM Vector Number canada V111955443 canada V733833 b) letting January of 2000 serve as base period, create index numbers of both variables and plot the two index numbers in the same diagram. c) Are these 2 variables positively or negatively correlated? come up with a theory to explain the correlation
Step by Step Solution
3.46 Rating (156 Votes )
There are 3 Steps involved in it

Get step-by-step solutions from verified subject matter experts