

? ? The financial statements of P&G are presented in Appendix B. The company s complete annual
Fantastic news! We've Found the answer you've been seeking!
Question:
?
Transcribed Image Text:
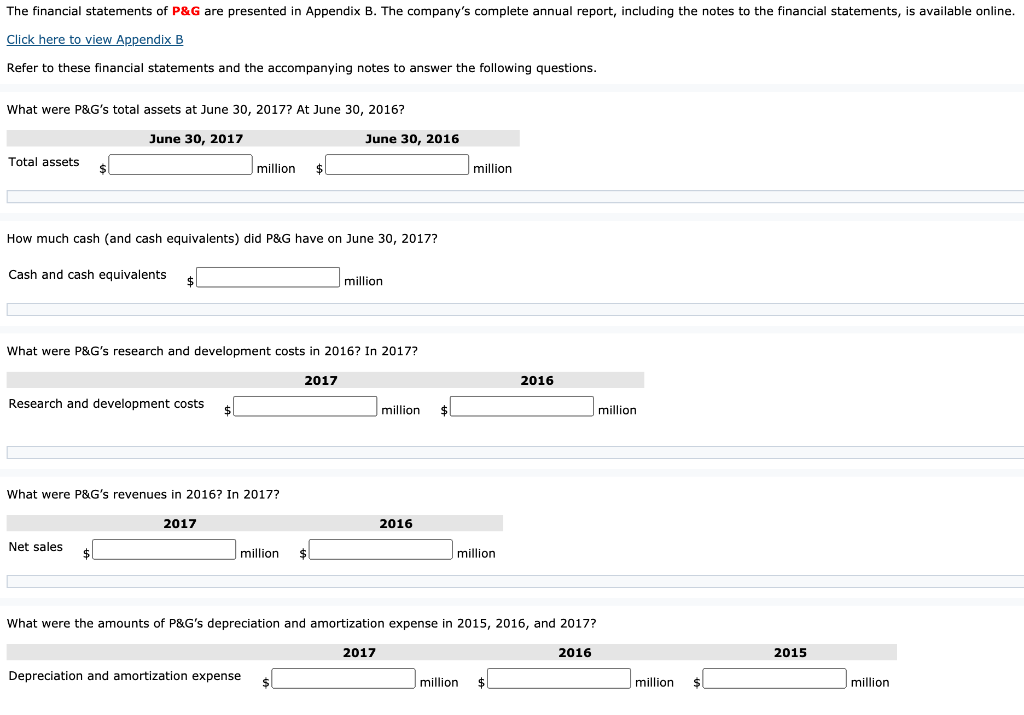
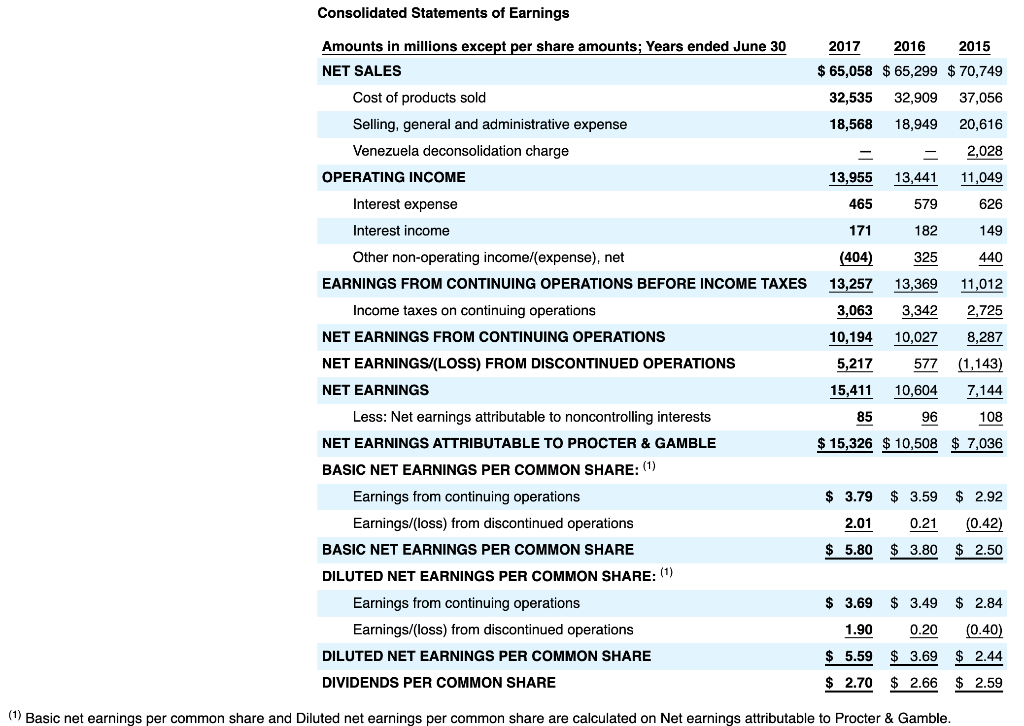
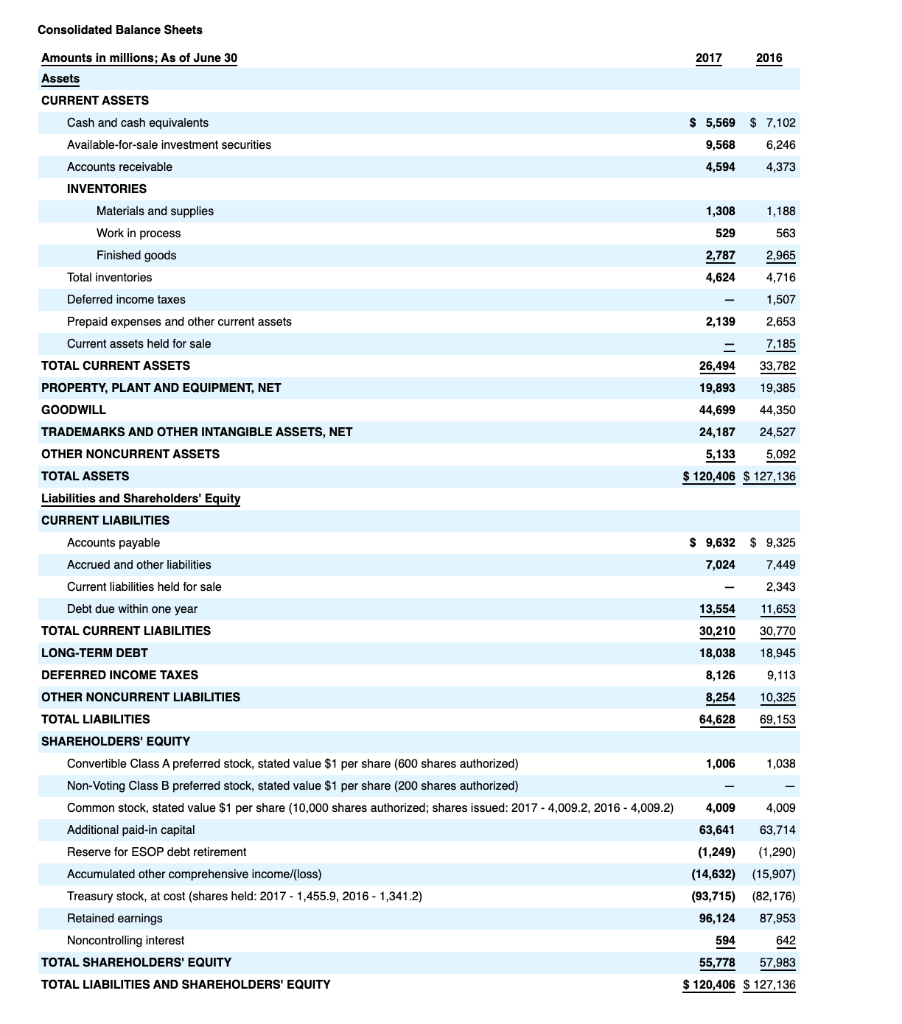
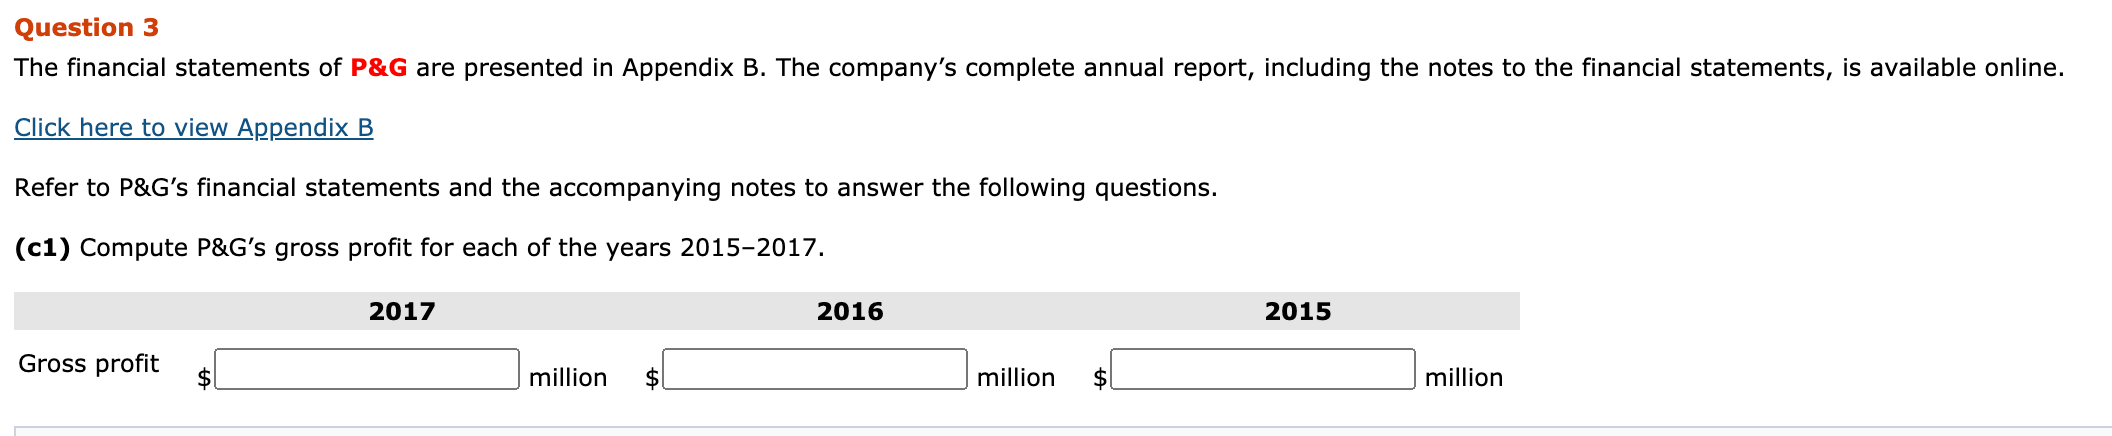
The financial statements of P&G are presented in Appendix B. The company s complete annual report, including the notes to the financial statements, is available online. Click here to view Appendix B Refer to these financial statements and the accompanying notes to answer the following questions. What were P&G s total assets at June 30, 2017? At June 30, 2016? June 30, 2017 Total assets Cash and cash equivalents How much cash (and cash equivalents) did P&G have on June 30, 2017? Research and development costs million What were P&G s research and development costs in 2016? In 2017? 2017 What were P&G s revenues in 2016? In 2017? Net sales 2017 June 30, 2016 million million Depreciation and amortization expense $ million $ 2016 million million What were the amounts of P&G s depreciation and amortization expense in 2015, 2016, and 2017? 2017 2016 million 2016 million million $ 2015 million Consolidated Statements of Earnings Amounts in millions except per share amounts; Years ended June 30 NET SALES Cost of products sold Selling, general and administrative expense Venezuela deconsolidation charge OPERATING INCOME Interest expense Interest income Other non-operating income/(expense), net EARNINGS FROM CONTINUING OPERATIONS BEFORE INCOME TAXES Income taxes on continuing operations NET EARNINGS FROM CONTINUING OPERATIONS NET EARNINGS/(LOSS) FROM DISCONTINUED OPERATIONS NET EARNINGS Less: Net earnings attributable to noncontrolling interests NET EARNINGS ATTRIBUTABLE TO PROCTER & GAMBLE BASIC NET EARNINGS PER COMMON SHARE: (1) Earnings from continuing operations Earnings/(loss) from discontinued operations BASIC NET EARNINGS PER COMMON SHARE DILUTED NET EARNINGS PER COMMON SHARE: (1) 2017 2016 $ 65,058 $ 65,299 32,535 32,909 18,568 18,949 2015 $ 70,749 37,056 20,616 2,028 11,049 626 149 440 13,369 11,012 3,063 3,342 2,725 10,194 10,027 8,287 5,217 (1,143) 15,411 577 10,604 96 7,144 108 85 $ 15,326 $10,508 $ 7,036 13,955 13,441 465 579 171 182 (404) 325 13,257 $ 3.79 $3.59 $2.92 2.01 0.21 (0.42) $5.80 $3.80 $2.50 Earnings from continuing operations Earnings/(loss) from discontinued operations $ 3.69 $3.49 $ 2.84 1.90 0.20 (0.40) $5.59 $3.69 $2.44 $ 2.70 $2.66 $2.59 DILUTED NET EARNINGS PER COMMON SHARE DIVIDENDS PER COMMON SHARE (1) Basic net earnings per common share and Diluted net earnings per common share are calculated on Net earnings attributable to Procter & Gamble. Consolidated Balance Sheets Amounts in millions; As of June 30 Assets CURRENT ASSETS Cash and cash equivalents Available-for-sale investment securities Accounts receivable INVENTORIES Materials and supplies Work in process Finished goods Total inventories Deferred income taxes Prepaid expenses and other current assets Current assets held for sale TOTAL CURRENT ASSETS PROPERTY, PLANT AND EQUIPMENT, NET GOODWILL TRADEMARKS AND OTHER INTANGIBLE ASSETS, NET OTHER NONCURRENT ASSETS TOTAL ASSETS Liabilities and Shareholders Equity CURRENT LIABILITIES Accounts payable Accrued and other liabilities Current liabilities held for sale Debt due within one year TOTAL CURRENT LIABILITIES LONG-TERM DEBT DEFERRED INCOME TAXES OTHER NONCURRENT LIABILITIES TOTAL LIABILITIES SHAREHOLDERS EQUITY Convertible Class A preferred stock, stated value $1 per share (600 shares authorized) Non-Voting Class B preferred stock, stated value $1 per share (200 shares authorized) Common stock, stated value $1 per share (10,000 shares authorized; shares issued: 2017-4,009.2, 2016 - 4,009.2) Additional paid-in capital Reserve for ESOP debt retirement Accumulated other comprehensive income/(loss) Treasury stock, at cost (shares held: 2017-1,455.9, 2016 - 1,341.2) Retained earnings Noncontrolling interest TOTAL SHAREHOLDERS EQUITY TOTAL LIABILITIES AND SHAREHOLDERS EQUITY 2017 $ 5,569 $ 7,102 9,568 6,246 4,594 4,373 1,308 529 1,188 563 2,965 4,716 1,507 2,653 = 7,185 26,494 33,782 19,893 19,385 44,699 44,350 24,187 24,527 5,133 5,092 $ 120,406 $ 127,136 2,787 4,624 2,139 2016 $ 9,632 $9,325 7,024 7,449 2,343 13,554 11,653 30,210 30,770 18,945 9,113 10,325 69,153 18,038 8,126 8,254 64,628 1,006 1,038 4,009 4,009 63,641 63,714 (1,249) (1,290) (14,632) (15,907) (93,715) (82,176) 96,124 87,953 594 642 55,778 57,983 $ 120,406 $ 127,136 Question 3 The financial statements of P&G are presented in Appendix B. The company s complete annual report, including the notes to the financial statements, is available online. Click here to view Appendix B Refer to P&G s financial statements and the accompanying notes to answer the following questions. (c1) Compute P&G s gross profit for each of the years 2015-2017. Gross profit 2017 million 2016 million 2015 million The financial statements of P&G are presented in Appendix B. The company s complete annual report, including the notes to the financial statements, is available online. Click here to view Appendix B Refer to these financial statements and the accompanying notes to answer the following questions. What were P&G s total assets at June 30, 2017? At June 30, 2016? June 30, 2017 Total assets Cash and cash equivalents How much cash (and cash equivalents) did P&G have on June 30, 2017? Research and development costs million What were P&G s research and development costs in 2016? In 2017? 2017 What were P&G s revenues in 2016? In 2017? Net sales 2017 June 30, 2016 million million Depreciation and amortization expense $ million $ 2016 million million What were the amounts of P&G s depreciation and amortization expense in 2015, 2016, and 2017? 2017 2016 million 2016 million million $ 2015 million Consolidated Statements of Earnings Amounts in millions except per share amounts; Years ended June 30 NET SALES Cost of products sold Selling, general and administrative expense Venezuela deconsolidation charge OPERATING INCOME Interest expense Interest income Other non-operating income/(expense), net EARNINGS FROM CONTINUING OPERATIONS BEFORE INCOME TAXES Income taxes on continuing operations NET EARNINGS FROM CONTINUING OPERATIONS NET EARNINGS/(LOSS) FROM DISCONTINUED OPERATIONS NET EARNINGS Less: Net earnings attributable to noncontrolling interests NET EARNINGS ATTRIBUTABLE TO PROCTER & GAMBLE BASIC NET EARNINGS PER COMMON SHARE: (1) Earnings from continuing operations Earnings/(loss) from discontinued operations BASIC NET EARNINGS PER COMMON SHARE DILUTED NET EARNINGS PER COMMON SHARE: (1) 2017 2016 $ 65,058 $ 65,299 32,535 32,909 18,568 18,949 2015 $ 70,749 37,056 20,616 2,028 11,049 626 149 440 13,369 11,012 3,063 3,342 2,725 10,194 10,027 8,287 5,217 (1,143) 15,411 577 10,604 96 7,144 108 85 $ 15,326 $10,508 $ 7,036 13,955 13,441 465 579 171 182 (404) 325 13,257 $ 3.79 $3.59 $2.92 2.01 0.21 (0.42) $5.80 $3.80 $2.50 Earnings from continuing operations Earnings/(loss) from discontinued operations $ 3.69 $3.49 $ 2.84 1.90 0.20 (0.40) $5.59 $3.69 $2.44 $ 2.70 $2.66 $2.59 DILUTED NET EARNINGS PER COMMON SHARE DIVIDENDS PER COMMON SHARE (1) Basic net earnings per common share and Diluted net earnings per common share are calculated on Net earnings attributable to Procter & Gamble. Consolidated Balance Sheets Amounts in millions; As of June 30 Assets CURRENT ASSETS Cash and cash equivalents Available-for-sale investment securities Accounts receivable INVENTORIES Materials and supplies Work in process Finished goods Total inventories Deferred income taxes Prepaid expenses and other current assets Current assets held for sale TOTAL CURRENT ASSETS PROPERTY, PLANT AND EQUIPMENT, NET GOODWILL TRADEMARKS AND OTHER INTANGIBLE ASSETS, NET OTHER NONCURRENT ASSETS TOTAL ASSETS Liabilities and Shareholders Equity CURRENT LIABILITIES Accounts payable Accrued and other liabilities Current liabilities held for sale Debt due within one year TOTAL CURRENT LIABILITIES LONG-TERM DEBT DEFERRED INCOME TAXES OTHER NONCURRENT LIABILITIES TOTAL LIABILITIES SHAREHOLDERS EQUITY Convertible Class A preferred stock, stated value $1 per share (600 shares authorized) Non-Voting Class B preferred stock, stated value $1 per share (200 shares authorized) Common stock, stated value $1 per share (10,000 shares authorized; shares issued: 2017-4,009.2, 2016 - 4,009.2) Additional paid-in capital Reserve for ESOP debt retirement Accumulated other comprehensive income/(loss) Treasury stock, at cost (shares held: 2017-1,455.9, 2016 - 1,341.2) Retained earnings Noncontrolling interest TOTAL SHAREHOLDERS EQUITY TOTAL LIABILITIES AND SHAREHOLDERS EQUITY 2017 $ 5,569 $ 7,102 9,568 6,246 4,594 4,373 1,308 529 1,188 563 2,965 4,716 1,507 2,653 = 7,185 26,494 33,782 19,893 19,385 44,699 44,350 24,187 24,527 5,133 5,092 $ 120,406 $ 127,136 2,787 4,624 2,139 2016 $ 9,632 $9,325 7,024 7,449 2,343 13,554 11,653 30,210 30,770 18,945 9,113 10,325 69,153 18,038 8,126 8,254 64,628 1,006 1,038 4,009 4,009 63,641 63,714 (1,249) (1,290) (14,632) (15,907) (93,715) (82,176) 96,124 87,953 594 642 55,778 57,983 $ 120,406 $ 127,136 Question 3 The financial statements of P&G are presented in Appendix B. The company s complete annual report, including the notes to the financial statements, is available online. Click here to view Appendix B Refer to P&G s financial statements and the accompanying notes to answer the following questions. (c1) Compute P&G s gross profit for each of the years 2015-2017. Gross profit 2017 million 2016 million 2015 million
Expert Answer:
Answer rating: 100% (QA)
The total assets at Amounts in millions excepting research and development costs June 30 2017 J... View the full answer

Related Book For 
Financial Accounting
ISBN: 978-1118978085
IFRS 3rd edition
Authors: Jerry J. Weygandt, Paul D. Kimmel, Donald E. Kieso
Posted Date:
Students also viewed these accounting questions
-
The norm of a linear transformation TA: Rn Rn can be defined by where the maximum is taken over all nonzero x in Rn. (The subscript indicates that the norm of the linear transformation on the left is...
-
Suppose that f: Rn R and g: Rn Rn are differentiable on Rn and that there exist r > 0 and a Rn such that Dg(x) is the identity matrix, I, for all x Br(a). Prove that there is a function h: Br(a) {a}...
-
Let 5: Rn Rn and T: Rn Rn be linear transformations with matrices A and B respectively. [Theorem 3.] (a) Show that B2 = B if and only if T2 = 7 (where T2 means T o T). (b) Show that B2 = 1 if and...
-
You would like to design a product to sell to shopping malls that tells them more about the behaviours of their customers. The system would use cameras to track customers as they walk from store to...
-
What is the molar solubility of CdC2O4 in 0.10 M NH3?
-
Presented below are two independent situations. 1. Flinthills Car Rental leased a car to Jayhawk Company for 11 months. Terms of the lease agreement call for monthly payments of $500. 2. On January...
-
Hooke's law is obeyed up to the (a) Yield point (b) Ultimate point (c) Breaking point (d) Limit of proportionality
-
The Chamber of Commerce in a Canadian city has conducted an evaluation of 300 restaurants in its metropolitan area. Each restaurant received a rating on a 3-point scale on typical meal price (1 least...
-
Would a transformational leader make a more successful strategic leader? Why should a transformational leader be better suited to do, as they work toward that common goal of inspiring individuals of...
-
The slender rod AB of negligible weight is attached to two 10-lb blocks A and B that can move freely in the guides shown. Knowing that the constant of the springs is 1 lb/in. and that the unstretched...
-
Background the advancement of information technology has seen the adaption of this knowledge in almost all sectors of the economy. a greater adoption of the said technology is evident in the criminal...
-
There are three pictures in Figure 18.29 (below) which can be used to find the growth rate of the boy. Explain what is being illustrated with this sequence of drawings. Why do you think we might...
-
Evaluate the area function for the functions given in Problems 1-8. Let \(y=5\); find \(A(8)\).
-
What are the main ideas of calculus? Briefly describe each of these main ideas. limits, derivatives, and integrals
-
What do we mean by the limit of a sequence?
-
Milk containing \(20 \%\) butterfat is mixed with cream containing \(60 \%\) butterfat to produce half-and-half, which is \(50 \%\) butterfat. How many gallons of each must be mixed to make 180...
-
Thomson Pharmaceuticals is constantly lowering prices, hoping to push their competitors out of the market. In the short-term, this is great for consumers as prices go down, but this practice is...
-
Write an essay describing the differing approaches of nursing leaders and managers to issues in practice. To complete this assignment, do the following: 1. Select an issue from the following list:...
-
Judi Dench is a licensed dentist. During the first month of the operation of her business, the following events and transactions occurred. April 1 Shareholders invested 40,000 cash in exchange for...
-
At the end of its first year, the trial balance of Zovde Company OAO shows Equipment 32,000 and zero balances in Accumulated Depreciation-Equipment and Depreciation Expense. Depreciation for the year...
-
Ethridge Drug Store has four employees who are paid on an hourly basis plus timeand- a-half for all hours worked in excess of 40 a week. Payroll data for the week ended February 15, 2017, are...
-
Derive the expression for the shape-efficiency factor \(\phi_{B}^{e}\) for stiffness-limited design for a circular tube with outer radius \(5 t\) and wall thickness \(t\), loaded in bending (Fig....
-
Derive the expression for the shape-efficiency factor \(\phi_{B}^{e}\) for stiffness-limited design for a channel section of thickness \(t\), overall flange width \(5 t\) and overall depth \(10 t\),...
-
Derive the expression for the shape-efficiency factor \(\phi_{B}^{e}\) for stiffness-limited design for a square box section of wall thickness \(t\), and height and width \(h_{1}=10 t\) bent about...

Study smarter with the SolutionInn App