

Imagine that Kelly Daniels, the owner of Kay Day's Boutique, has asked you to give her...
Fantastic news! We've Found the answer you've been seeking!
Question:
Transcribed Image Text:
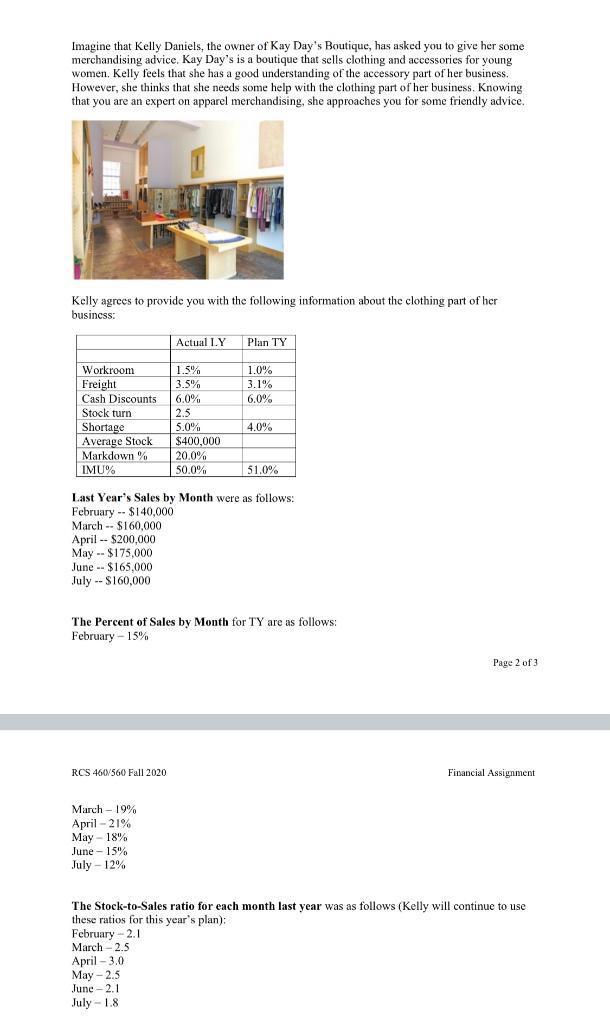
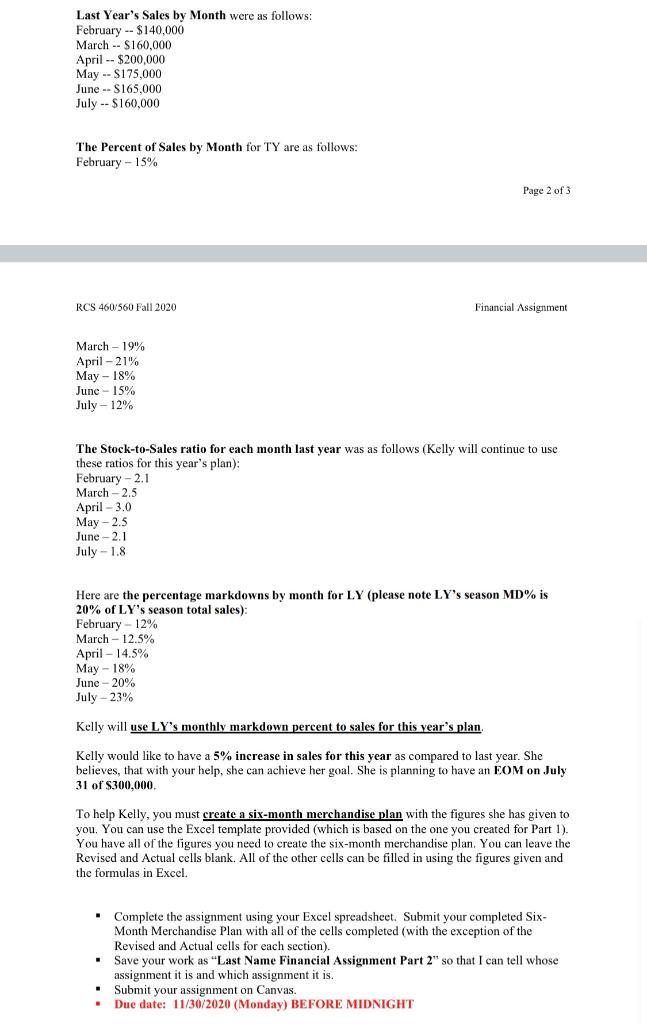
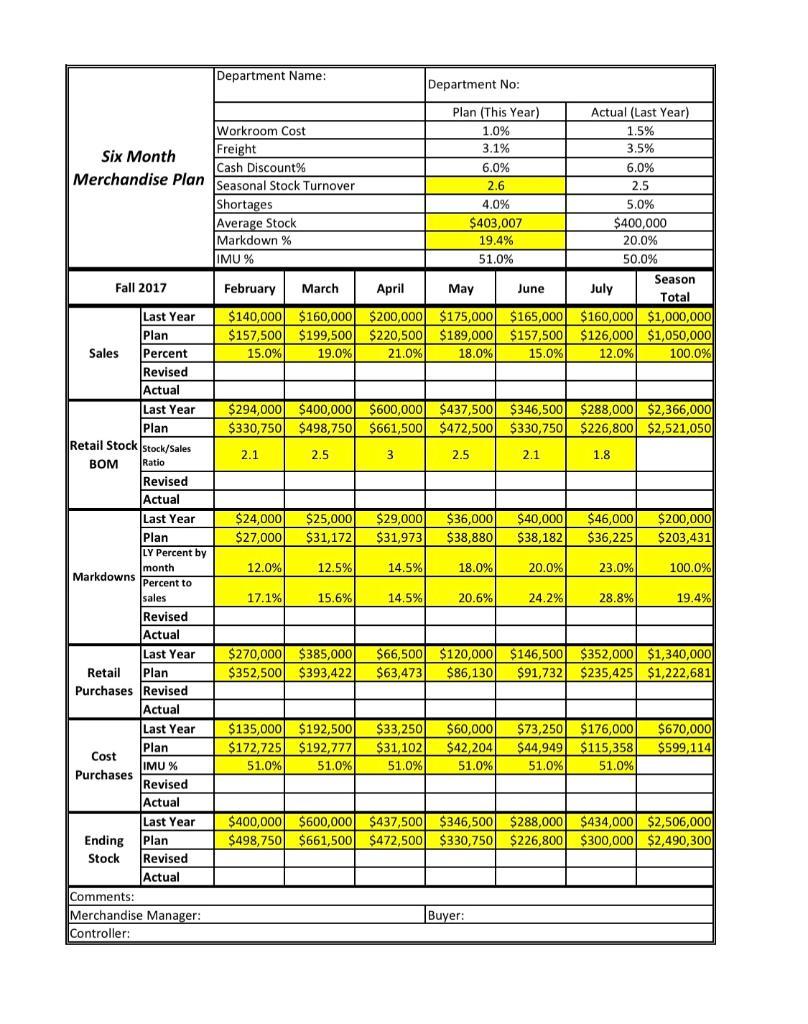
Imagine that Kelly Daniels, the owner of Kay Day's Boutique, has asked you to give her some merchandising advice. Kay Day's is a boutique that sells clothing and accessories for young women. Kelly feels that she has a good understanding of the accessory part of her business. However, she thinks that she needs some help with the clothing part of her business. Knowing that you are an expert on apparel merchandising, she approaches you for some friendly advice. Kelly agrees to provide you with the following information about the clothing part of her business: Workroom Freight Cash Discounts. Stock turn Shortage Average Stock Markdown % IMU% June $165,000 July $160,000 RCS 460/560 Fall 2020 Actual LY March - 19% April 21% May 18% June 15% July - 12% 1.5% 3.5% 6.0% 2.5 5.0% $400,000 20.0% 50.0% Plan TY Last Year's Sales by Month were as follows: February $140,000. March $160,000 April - $200,000 May $175,000 March 2.5 April 3.0 - May-2.5 June 2.1 July 1.8 - 1.0% 3.1% 6.0% 4.0% The Percent of Sales by Month for TY are as follows: February -15% 51.0% Page 2 of 3 Financial Assignment The Stock-to-Sales ratio for each month last year was as follows (Kelly will continue to use these ratios for this year's plan): February-2.1 Last Year's Sales by Month were as follows: February $140,000 March $160,000 April $200,000 May $175,000 June $165,000 July $160,000 The Percent of Sales by Month for TY are as follows: February - 15% RCS 460/560 Fall 2020 March - 19% April - 21% May 18% June 15% July 12%- Page 2 of 3 Financial Assignment The Stock-to-Sales ratio for each month last year was as follows (Kelly will continue t use these ratios for this year's plan): February 2.1 March 2.5 April-3.0 May-2.5 June-2.1 July - 1.8 Here are the percentage markdowns by month for LY (please note LY's season MD% is 20% of LY's season total sales): February - 12% March - 12.5% April 14.5% May - 18% June - 20% July 23% Kelly will use LY's monthly markdown percent to sales for this year's plan. Kelly would like to have a 5% increase in sales for this year as compared to last year. She believes, that with your help, she can achieve her goal. She is planning to have an EOM on July 31 of $300,000. . To help Kelly, you must create a six-month merchandise plan with the figures she has given to you. You can use the Excel template provided (which is based on the one you created for Part 1). You have all of the figures you need to create the six-month merchandise plan. You can leave the Revised and Actual cells blank. All of the other cells can be filled in using the figures given and the formulas in Excel. Complete the assignment using your Excel spreadsheet. Submit your completed Six- Month Merchandise Plan with all of the cells completed (with the exception of the Revised and Actual cells for each section). Save your work as "Last Name Financial Assignment Part 2" so that I can tell whose assignment it is and which assignment it is. Submit your assignment on Canvas. Due date: 11/30/2020 (Monday) BEFORE MIDNIGHT Six Month Merchandise Plan Fall 2017 Sales Last Year Plan Percent Revised Actual Last Year Plan Retail Stock stock/Sales BOM Ratio Cost Purchases Revised Actual Last Year Plan LY Percent by month Percent to sales Markdowns are Revised Actual Last Year Retail Plan Purchases Revised Actual Last Year Plan IMU % Revised Actual Last Year Ending Plan Stock Revised Actual Comments: Merchandise Manager: Controller: Department Name: Workroom Cost Freight Cash Discount% Seasonal Stock Turnover Shortages Average Stock Markdown % IMU % February March April $140,000 $160,000 $200,000 $157,500 $199,500 $220,500 19.0% 15.0% 21.0% $24,000 $27.000 12.0% 17.1% $25,000 $31,172 12.5% 15.6% $294,000 $400,000 $600,000 $437,500 $346,500 $288,000 $2,366,000 $330,750 $498,750 $661,500 $472,500 $330,750 $226,800 $2,521,050 2.1 2.5 3 2.5 2.1 1.8 $270,000 $385,000 $352,500 $393,422 $29,000 $31,973 14.5% 14.5% $66,500 $63,473 Department No: $135,000 $192,500 $33,250 $172,725 $192,777 $31,102 51.0% 51.0% 51.0% Plan (This Year) 1.0% 3.1% 6.0% 2.6 4.0% $403,007 19.4% 51.0% $36,000 $38,880 Season May June July Total $175,000 $165,000 $160,000 $1,000,000 $189,000 $157,500 $126,000 $1,050,000 18.0% 15.0% 12.0% 100.0% 18.0% 20.6% $60,000 $42,204 51.0% Actual (Last Year) 1.5% 3.5% Buyer: 6.0% 2.5 5.0% 20.0% $400,000 20.0% 50.0% 24.2% $40,000 $46,000 $38,182 $36,225 23.0% 28.8% $200,000 $203,431 100.0% $120,000 $146,500 $352,000 $1,340,000 $86,130 $91,732 $235,425 $1,222,681 19.4% $73,250 $176,000 $670,000 $44,949 $115,358 $599,114 51.0 % 51.0% $400,000 $600,000 $437,500 $346,500 $288,000 $434,000 $2,506,000 $498,750 $661,500 $472,500 $330,750 $226,800 $300,000 $2,490,300 Imagine that Kelly Daniels, the owner of Kay Day's Boutique, has asked you to give her some merchandising advice. Kay Day's is a boutique that sells clothing and accessories for young women. Kelly feels that she has a good understanding of the accessory part of her business. However, she thinks that she needs some help with the clothing part of her business. Knowing that you are an expert on apparel merchandising, she approaches you for some friendly advice. Kelly agrees to provide you with the following information about the clothing part of her business: Workroom Freight Cash Discounts. Stock turn Shortage Average Stock Markdown % IMU% June $165,000 July $160,000 RCS 460/560 Fall 2020 Actual LY March - 19% April 21% May 18% June 15% July - 12% 1.5% 3.5% 6.0% 2.5 5.0% $400,000 20.0% 50.0% Plan TY Last Year's Sales by Month were as follows: February $140,000. March $160,000 April - $200,000 May $175,000 March 2.5 April 3.0 - May-2.5 June 2.1 July 1.8 - 1.0% 3.1% 6.0% 4.0% The Percent of Sales by Month for TY are as follows: February -15% 51.0% Page 2 of 3 Financial Assignment The Stock-to-Sales ratio for each month last year was as follows (Kelly will continue to use these ratios for this year's plan): February-2.1 Last Year's Sales by Month were as follows: February $140,000 March $160,000 April $200,000 May $175,000 June $165,000 July $160,000 The Percent of Sales by Month for TY are as follows: February - 15% RCS 460/560 Fall 2020 March - 19% April - 21% May 18% June 15% July 12%- Page 2 of 3 Financial Assignment The Stock-to-Sales ratio for each month last year was as follows (Kelly will continue t use these ratios for this year's plan): February 2.1 March 2.5 April-3.0 May-2.5 June-2.1 July - 1.8 Here are the percentage markdowns by month for LY (please note LY's season MD% is 20% of LY's season total sales): February - 12% March - 12.5% April 14.5% May - 18% June - 20% July 23% Kelly will use LY's monthly markdown percent to sales for this year's plan. Kelly would like to have a 5% increase in sales for this year as compared to last year. She believes, that with your help, she can achieve her goal. She is planning to have an EOM on July 31 of $300,000. . To help Kelly, you must create a six-month merchandise plan with the figures she has given to you. You can use the Excel template provided (which is based on the one you created for Part 1). You have all of the figures you need to create the six-month merchandise plan. You can leave the Revised and Actual cells blank. All of the other cells can be filled in using the figures given and the formulas in Excel. Complete the assignment using your Excel spreadsheet. Submit your completed Six- Month Merchandise Plan with all of the cells completed (with the exception of the Revised and Actual cells for each section). Save your work as "Last Name Financial Assignment Part 2" so that I can tell whose assignment it is and which assignment it is. Submit your assignment on Canvas. Due date: 11/30/2020 (Monday) BEFORE MIDNIGHT Six Month Merchandise Plan Fall 2017 Sales Last Year Plan Percent Revised Actual Last Year Plan Retail Stock stock/Sales BOM Ratio Cost Purchases Revised Actual Last Year Plan LY Percent by month Percent to sales Markdowns are Revised Actual Last Year Retail Plan Purchases Revised Actual Last Year Plan IMU % Revised Actual Last Year Ending Plan Stock Revised Actual Comments: Merchandise Manager: Controller: Department Name: Workroom Cost Freight Cash Discount% Seasonal Stock Turnover Shortages Average Stock Markdown % IMU % February March April $140,000 $160,000 $200,000 $157,500 $199,500 $220,500 19.0% 15.0% 21.0% $24,000 $27.000 12.0% 17.1% $25,000 $31,172 12.5% 15.6% $294,000 $400,000 $600,000 $437,500 $346,500 $288,000 $2,366,000 $330,750 $498,750 $661,500 $472,500 $330,750 $226,800 $2,521,050 2.1 2.5 3 2.5 2.1 1.8 $270,000 $385,000 $352,500 $393,422 $29,000 $31,973 14.5% 14.5% $66,500 $63,473 Department No: $135,000 $192,500 $33,250 $172,725 $192,777 $31,102 51.0% 51.0% 51.0% Plan (This Year) 1.0% 3.1% 6.0% 2.6 4.0% $403,007 19.4% 51.0% $36,000 $38,880 Season May June July Total $175,000 $165,000 $160,000 $1,000,000 $189,000 $157,500 $126,000 $1,050,000 18.0% 15.0% 12.0% 100.0% 18.0% 20.6% $60,000 $42,204 51.0% Actual (Last Year) 1.5% 3.5% Buyer: 6.0% 2.5 5.0% 20.0% $400,000 20.0% 50.0% 24.2% $40,000 $46,000 $38,182 $36,225 23.0% 28.8% $200,000 $203,431 100.0% $120,000 $146,500 $352,000 $1,340,000 $86,130 $91,732 $235,425 $1,222,681 19.4% $73,250 $176,000 $670,000 $44,949 $115,358 $599,114 51.0 % 51.0% $400,000 $600,000 $437,500 $346,500 $288,000 $434,000 $2,506,000 $498,750 $661,500 $472,500 $330,750 $226,800 $300,000 $2,490,300
Expert Answer:
Answer rating: 100% (QA)
To create a sixmonth merchandise plan for Kay Days Boutique well take into account the given information and Kellys goal of achieving a 5 increase in ... View the full answer

Related Book For 

Elementary Statistics Picturing the World
ISBN: 978-0321911216
6th edition
Authors: Ron Larson, Betsy Farber
Posted Date:
Students also viewed these finance questions
-
You are shopping, and your roommate has asked you to pick up toothpaste and dental rinse. However, your roommate did not tell you which brands to get. The store has eight brands of toothpaste and...
-
You are Renata's assistant and she has asked you to prepare a memo to Dan describing the effect of each of the following bond features on the coupon rate of the bond She would also like you to list...
-
The plant manager has asked you to do a cost analysis to determine when currently owned equipment should be replaced. The manager stated that under no circumstances will the existing equipment be...
-
Superior Gaming, a computer enhancement company, has three product lines: audio enhancers, video enhancers, and connection-speed accelerators. Common costs are allocated based on relative sales. A...
-
For his business, Nicholas leased equipment valued at $23 000. The terms of the lease required payments of $1800 every month. If the first payment is due nine months after the lease was signed and...
-
The following case was developed by the Ernst & Young Academic Resource Center, which is sponsored by the Ernest & Young Foundation. Robotic process automation is growing in importance in the...
-
To the left of z = 1.625 Find the indicated area under the standard normal curve. If convenient, use technology to find the area.
-
The following information about the payroll for the week ended December 30 was obtained from the records of Arnsparger Equipment Co.: Tax rates assumed: Social security, 6% Medicare, 1.5% State...
-
The plaintiff, WandaRer, is aCanadian and a self-described artist, photographer, and social media influencer. For almost a decade, Ms. Rer has traveled the world with her camera. Ms. Rer has her...
-
Laurman, Inc. is considering a new project and has provided the details of the project. The Controller has asked you to compute various capital budgeting methods to help aid in the decision to pursue...
-
Paradiso PLC is a tanning company incorporated in Japan and with a branch in Croatia, its main market. Full processing of the raw materials into finished products takes place in Japan and then...
-
An experimental drug is administered to 60 randomly selected individuals, with the number of individuals responding favorably recorded. Determine which of the following probability experiments...
-
____________ A set of sample means is more likely to result in rejection of the hypothesis of equal population means if the variability within the populations is smaller.
-
11 C 5 Find the value of each combination.
-
____________ When there are only two samples, you should prefer the independent samples t test because it has more statistical power than the ANOVA.
-
n = 11, p = 0.75, x 8 A binomial probability experiment is conducted with the given parameters. Compute the probability of x successes in the n independent trials of the experiment.
-
. An economist investigating the tea market assumes that Q t = f(P t , Y,A,N, P c ) where Q t is the quantity of tea demanded, P t is the price of tea, Y is the average household income, A is the...
-
Fill in each blank so that the resulting statement is true. A solution to a system of linear equations in two variables is an ordered pair that__________ .
-
The lengths of time (in years) it took a random sample of 32 former smokers to quit smoking permanently are listed. Assume the population standard deviation is 6.2 years. At = 0.05, is there enough...
-
A consumer group claims that the mean annual consumption of cheddar cheese by a person in the United States is at most 10.3 pounds. A random sample of 100 people in the United States has a mean...
-
Use a stem-and-leaf plot to organize the ages of the 50 most powerful women listed on page 39. Describe any patterns. 26, 31, 35, 37, 43, 43, 43, 44, 45, 47, 48, 48, 49, 50, 51, 51, 51, 51, 52, 54,...
-
If two countries had identical term structures of interest rates, what is the expected future exchange rate change between the two currencies?
-
Pick three developing countries and create a country risk index for them. Rank them ordinally in terms of factors that you can observe (exports, GDP growth, reserves, etc.) by looking at...
-
Give examples of policies that a country could implement to reduce its absorption.

Study smarter with the SolutionInn App