

. Part (B): Second, use your suggested improvement to obtain a monthly sales forecast for each...
Fantastic news! We've Found the answer you've been seeking!
Question:
Transcribed Image Text:
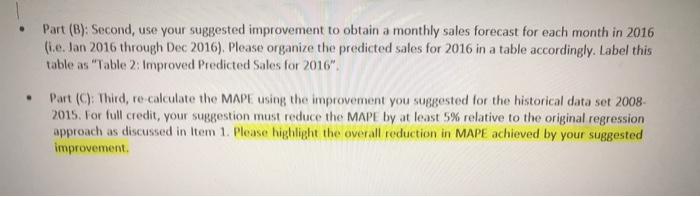
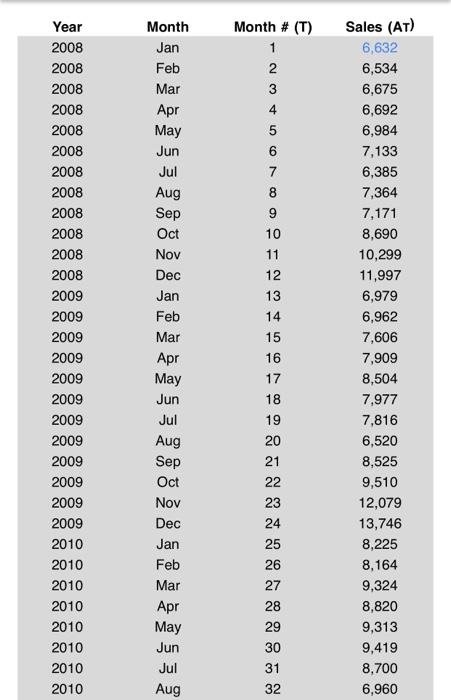
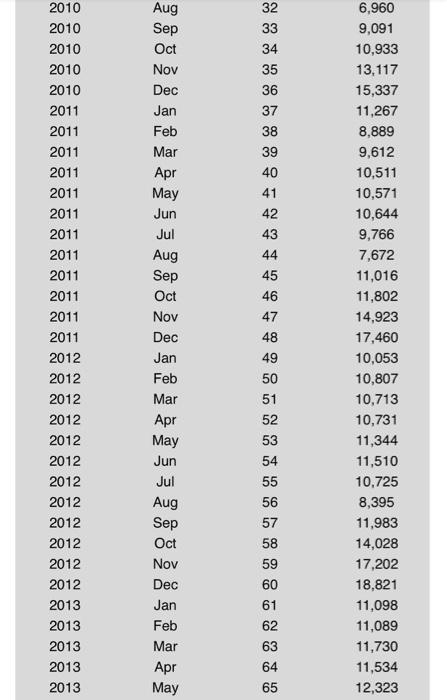
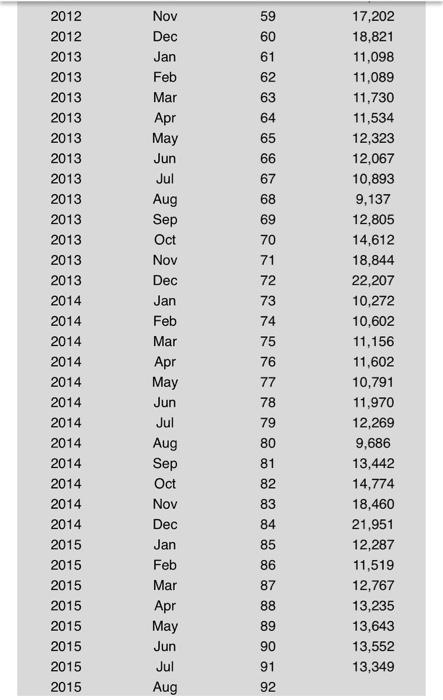
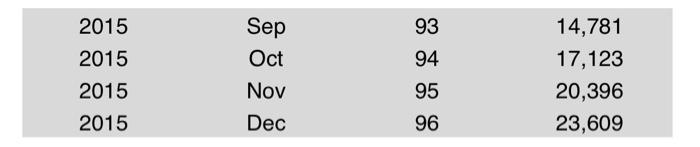
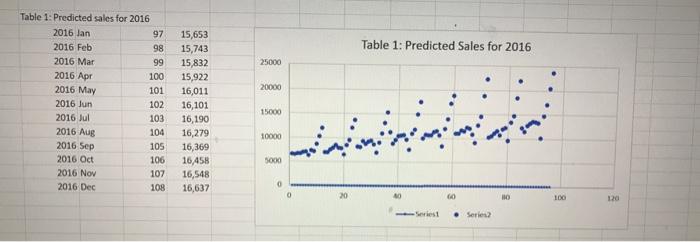
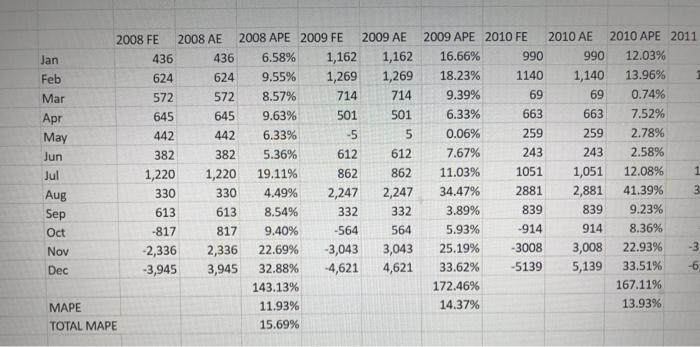
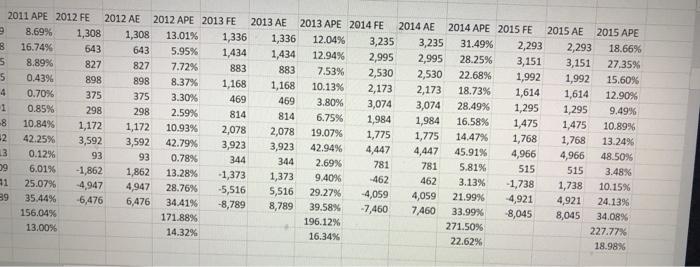
. Part (B): Second, use your suggested improvement to obtain a monthly sales forecast for each month in 2016 (i.e. Jan 2016 through Dec 2016). Please organize the predicted sales for 2016 in a table accordingly. Label this table as "Table 2: Improved Predicted Sales for 2016". Part (C): Third, re-calculate the MAPE using the improvement you suggested for the historical data set 2008- 2015. For full credit, your suggestion must reduce the MAPE by at least 5% relative to the original regression approach as discussed in Item 1. Please highlight the overall reduction in MAPE achieved by your suggested improvement. Year 2008 2008 2008 2008 2008 2008 2008 2008 2008 2008 2008 2008 2009 2009 2009 2009 2009 2009 2009 2009 2009 2009 2009 2009 2010 2010 2010 2010 2010 2010 2010 2010 Month Jan Feb Mar Apr May Jun Jul Aug Sep Oct Nov Dec Jan Feb Mar Apr May Jun Jul Aug Sep Oct Nov Dec Jan Feb Mar Apr May Jun Jul Aug Month # (T) 1 2 3 4 5 697 8 9 10 11 12 13 14 15 16 17 18 19 20 21 22 23 24 25 26 27 28 29 30 31 32 Sales (AT) 6,632 6,534 6,675 6,692 6,984 7,133 6,385 7,364 7,171 8,690 10,299 11,997 6,979 6,962 7,606 7,909 8,504 7,977 7,816 6,520 8,525 9,510 12,079 13,746 8,225 8,164 9,324 8,820 9,313 9,419 8,700 6,960 2010 2010 2010 2010 2010 2011 2011 2011 2011 2011 2011 2011 2011 2011 2011 2011 2011 2012 2012 2012 2012 2012 2012 2012 2012 2012 2012 2012 2012 2013 2013 2013 2013 2013 Aug Sep Oct Nov Dec Jan Feb Mar Apr May Jun Jul Aug Sep Oct Nov Dec Jan Feb Mar Apr May Jun Jul Aug Sep Oct Nov Dec Jan Feb Mar Apr May 32 33 34 35 36 37 38 39 40 41 42 43 44 45 46 47 48 49 50 51 52 53 54 55 56 57 58 59 60 61 62 63 64 65 6,960 9,091 10,933 13,117 15,337 11,267 8,889 9,612 10,511 10,571 10,644 9,766 7,672 11,016 11,802 14,923 17,460 10,053 10,807 10,713 10,731 11,344 11,510 10,725 8,395 11,983 14,028 17,202 18,821 11,098 11,089 11,730 11,534 12,323 2012 2012 2013 2013 2013 2013 2013 2013 2013 2013 2013 2013 2013 2013 2014 2014 2014 2014 2014 2014 2014 2014 2014 2014 2014 2014 2015 2015 2015 2015 2015 2015 2015 2015 Nov Dec Jan Feb Mar Apr May Jun Jul Aug Sep Oct Nov Dec Jan Feb Mar Apr May Jun Jul Aug Sep Oct Nov Dec Jan Feb Mar Apr May Jun Jul Aug 59 60 61 62 63 64 65 66 67 68 69 70 71 72 73 74 75 75 7 78 79 80 81 82 76 77 83 84 85 86 87 88 89 90 91 92 17,202 18,821 11,098 11,089 11,730 11,534 12,323 12,067 10,893 9,137 12,805 14,612 18,844 22,207 10,272 10,602 11,156 11,602 10,791 11,970 12,269 9,686 13,442 14,774 18,460 21,951 12,287 11,519 12,767 13,235 13,643 13,552 13,349 2015 2015 2015 2015 Sep Oct Nov Dec 93 94 95 96 14,781 17,123 20,396 23,609 Table 1: Predicted sales for 2016 2016 Jan 2016 Feb 2016 Mar 2016 Apr 2016 May 2016 Jun 2016 Jul 2016 Aug 2016 Sep 2016 Oct 2016 Nov 2016 Dec 97 98 15,653 15,743 99 15,832 100 15,922 101 16,011 102 16,101 103 16,190 104 16,279 105 106 107 108 16,369 16,458 16,548 16,637 25000 20000 15000 10000 5000 0 Table 1: Predicted Sales for 2016 wwwwww 20 -Seriest 60 Series2 110 100 120 Jan Feb Mar Apr May Jun Jul Aug Sep Oct Nov Dec 2008 FE MAPE TOTAL MAPE 436 624 572 645 442 382 1,220 330 613 2008 AE -81 -2,336 -3,945 2008 APE 2009 FE 6.58% 9.55% 8.57% 9.63% 442 6.33% 382 5.36% 1,220 19.11% 330 4.49% 613 8.54% 817 9.40% 22.69% 32.88% 143.13% 436 624 572 645 2,336 3,945 2009 APE 2010 FE 1,162 1,162 16.66% 1,269 1,269 18.23% 714 714 501 11.93% 15.69% 2009 AE -5 612 862 501 5 9.39% 6.33% 0.06% 612 7.67% 862 11.03% 2,247 2,247 34.47% 332 332 3.89% -564 564 5.93% -3,043 3,043 25.19% -4,621 4,621 33.62% 172.46% 14.37% 990 1140 69 663 259 243 1051 2881 839 -914 -3008 -5139 2010 AE 2010 APE 2011 12.03% 990 1,140 13.96% 69 0.74% 663 7.52% 259 2.78% 243 2.58% 1,051 12.08% 2,881 41.39% 839 9.23% 914 8.36% 3,008 5,139 22.93% 33.51% 167.11% 13.93% 1 3 -3 -6 2011 APE 2012 FE 2012 AE 2012 APE 2013 FE 2013 AE 2013 APE 2014 FE 2014 AE 2014 APE 2015 FE 8.69% 1,308 3,235 31.49% 2,293 16.74% 643 2,995 28.25% 3,151 827 2,530 22.68% 1,992 2,173 18.73% 1,614 28.49% 1,295 1,984 16.58% 1,475 1,775 14.47% 1,768 4,447 45.91% 4,966 781 5.81% 515 462 3.13% 4,059 21.99 % 7,460 33.99% 271.50% 22.62% 9 3 5 8.89% 5 0.43% 4 0.70% 1 0.85% -8 10.84% -2 42.25% 13 0.12% 09 6.01% 41 25.07% 39 35.44% 156.04% 13.00% 898 375 298 1,172 3,592 93 -1,862 4,947 -6,476 1,308 13.01% 1,336 1,336 12.04% 3,235 643 5.95% 1,434 1,434 12.94% 2,995 827 7.72% 883 883 7.53% 2,530 898 8.37% 1,168 1,168 10.13% 2,173 375 3.30% 469 469 3.80% 3,074 3,074 298 2.59% 814 814 6.75% 1,984 1,172 10.93% 2,078 2,078 19.07% 1,775 3,592 42.79% 3,923 3,923 42.94% 4,447 93 0.78% 344 344 2.69% 781 13.28% 1,373 9.40% -462 28.76% 5,516 29.27% 34.41% 8,789 39.58% 171.88% 196.12% 14.32% 16.34% 1,862 4,947 6,476 -1,373 -5,516 -8,789 -4,059 -7,460 -1,738 -4,921 -8,045 2015 AE 2015 APE 2,293 18.66% 3,151 27.35% 1,992 15.60% 1,614 12.90% 1,295 9.49% 1,475 10.89% 1,768 13.24% 4,966 48.50% 515 3.48% 1,738 10.15% 4,921 24.13% 8,045 34.08% 227.77% 18.98% . Part (B): Second, use your suggested improvement to obtain a monthly sales forecast for each month in 2016 (i.e. Jan 2016 through Dec 2016). Please organize the predicted sales for 2016 in a table accordingly. Label this table as "Table 2: Improved Predicted Sales for 2016". Part (C): Third, re-calculate the MAPE using the improvement you suggested for the historical data set 2008- 2015. For full credit, your suggestion must reduce the MAPE by at least 5% relative to the original regression approach as discussed in Item 1. Please highlight the overall reduction in MAPE achieved by your suggested improvement. Year 2008 2008 2008 2008 2008 2008 2008 2008 2008 2008 2008 2008 2009 2009 2009 2009 2009 2009 2009 2009 2009 2009 2009 2009 2010 2010 2010 2010 2010 2010 2010 2010 Month Jan Feb Mar Apr May Jun Jul Aug Sep Oct Nov Dec Jan Feb Mar Apr May Jun Jul Aug Sep Oct Nov Dec Jan Feb Mar Apr May Jun Jul Aug Month # (T) 1 2 3 4 5 697 8 9 10 11 12 13 14 15 16 17 18 19 20 21 22 23 24 25 26 27 28 29 30 31 32 Sales (AT) 6,632 6,534 6,675 6,692 6,984 7,133 6,385 7,364 7,171 8,690 10,299 11,997 6,979 6,962 7,606 7,909 8,504 7,977 7,816 6,520 8,525 9,510 12,079 13,746 8,225 8,164 9,324 8,820 9,313 9,419 8,700 6,960 2010 2010 2010 2010 2010 2011 2011 2011 2011 2011 2011 2011 2011 2011 2011 2011 2011 2012 2012 2012 2012 2012 2012 2012 2012 2012 2012 2012 2012 2013 2013 2013 2013 2013 Aug Sep Oct Nov Dec Jan Feb Mar Apr May Jun Jul Aug Sep Oct Nov Dec Jan Feb Mar Apr May Jun Jul Aug Sep Oct Nov Dec Jan Feb Mar Apr May 32 33 34 35 36 37 38 39 40 41 42 43 44 45 46 47 48 49 50 51 52 53 54 55 56 57 58 59 60 61 62 63 64 65 6,960 9,091 10,933 13,117 15,337 11,267 8,889 9,612 10,511 10,571 10,644 9,766 7,672 11,016 11,802 14,923 17,460 10,053 10,807 10,713 10,731 11,344 11,510 10,725 8,395 11,983 14,028 17,202 18,821 11,098 11,089 11,730 11,534 12,323 2012 2012 2013 2013 2013 2013 2013 2013 2013 2013 2013 2013 2013 2013 2014 2014 2014 2014 2014 2014 2014 2014 2014 2014 2014 2014 2015 2015 2015 2015 2015 2015 2015 2015 Nov Dec Jan Feb Mar Apr May Jun Jul Aug Sep Oct Nov Dec Jan Feb Mar Apr May Jun Jul Aug Sep Oct Nov Dec Jan Feb Mar Apr May Jun Jul Aug 59 60 61 62 63 64 65 66 67 68 69 70 71 72 73 74 75 75 7 78 79 80 81 82 76 77 83 84 85 86 87 88 89 90 91 92 17,202 18,821 11,098 11,089 11,730 11,534 12,323 12,067 10,893 9,137 12,805 14,612 18,844 22,207 10,272 10,602 11,156 11,602 10,791 11,970 12,269 9,686 13,442 14,774 18,460 21,951 12,287 11,519 12,767 13,235 13,643 13,552 13,349 2015 2015 2015 2015 Sep Oct Nov Dec 93 94 95 96 14,781 17,123 20,396 23,609 Table 1: Predicted sales for 2016 2016 Jan 2016 Feb 2016 Mar 2016 Apr 2016 May 2016 Jun 2016 Jul 2016 Aug 2016 Sep 2016 Oct 2016 Nov 2016 Dec 97 98 15,653 15,743 99 15,832 100 15,922 101 16,011 102 16,101 103 16,190 104 16,279 105 106 107 108 16,369 16,458 16,548 16,637 25000 20000 15000 10000 5000 0 Table 1: Predicted Sales for 2016 wwwwww 20 -Seriest 60 Series2 110 100 120 Jan Feb Mar Apr May Jun Jul Aug Sep Oct Nov Dec 2008 FE MAPE TOTAL MAPE 436 624 572 645 442 382 1,220 330 613 2008 AE -81 -2,336 -3,945 2008 APE 2009 FE 6.58% 9.55% 8.57% 9.63% 442 6.33% 382 5.36% 1,220 19.11% 330 4.49% 613 8.54% 817 9.40% 22.69% 32.88% 143.13% 436 624 572 645 2,336 3,945 2009 APE 2010 FE 1,162 1,162 16.66% 1,269 1,269 18.23% 714 714 501 11.93% 15.69% 2009 AE -5 612 862 501 5 9.39% 6.33% 0.06% 612 7.67% 862 11.03% 2,247 2,247 34.47% 332 332 3.89% -564 564 5.93% -3,043 3,043 25.19% -4,621 4,621 33.62% 172.46% 14.37% 990 1140 69 663 259 243 1051 2881 839 -914 -3008 -5139 2010 AE 2010 APE 2011 12.03% 990 1,140 13.96% 69 0.74% 663 7.52% 259 2.78% 243 2.58% 1,051 12.08% 2,881 41.39% 839 9.23% 914 8.36% 3,008 5,139 22.93% 33.51% 167.11% 13.93% 1 3 -3 -6 2011 APE 2012 FE 2012 AE 2012 APE 2013 FE 2013 AE 2013 APE 2014 FE 2014 AE 2014 APE 2015 FE 8.69% 1,308 3,235 31.49% 2,293 16.74% 643 2,995 28.25% 3,151 827 2,530 22.68% 1,992 2,173 18.73% 1,614 28.49% 1,295 1,984 16.58% 1,475 1,775 14.47% 1,768 4,447 45.91% 4,966 781 5.81% 515 462 3.13% 4,059 21.99 % 7,460 33.99% 271.50% 22.62% 9 3 5 8.89% 5 0.43% 4 0.70% 1 0.85% -8 10.84% -2 42.25% 13 0.12% 09 6.01% 41 25.07% 39 35.44% 156.04% 13.00% 898 375 298 1,172 3,592 93 -1,862 4,947 -6,476 1,308 13.01% 1,336 1,336 12.04% 3,235 643 5.95% 1,434 1,434 12.94% 2,995 827 7.72% 883 883 7.53% 2,530 898 8.37% 1,168 1,168 10.13% 2,173 375 3.30% 469 469 3.80% 3,074 3,074 298 2.59% 814 814 6.75% 1,984 1,172 10.93% 2,078 2,078 19.07% 1,775 3,592 42.79% 3,923 3,923 42.94% 4,447 93 0.78% 344 344 2.69% 781 13.28% 1,373 9.40% -462 28.76% 5,516 29.27% 34.41% 8,789 39.58% 171.88% 196.12% 14.32% 16.34% 1,862 4,947 6,476 -1,373 -5,516 -8,789 -4,059 -7,460 -1,738 -4,921 -8,045 2015 AE 2015 APE 2,293 18.66% 3,151 27.35% 1,992 15.60% 1,614 12.90% 1,295 9.49% 1,475 10.89% 1,768 13.24% 4,966 48.50% 515 3.48% 1,738 10.15% 4,921 24.13% 8,045 34.08% 227.77% 18.98%
Expert Answer:
Answer rating: 100% (QA)
Table 2 Improved Predicted Sales for 2016 Month T Sales AT Jan 2016 6632 Feb 2016 6534 Mar 2016 6675 ... View the full answer

Related Book For 

Statistics The Art and Science of Learning from Data
ISBN: 978-0321997838
4th edition
Authors: Alan Agresti, Christine A. Franklin, Bernhard Klingenberg
Posted Date:
Students also viewed these mathematics questions
-
Determine CPI, ETC (1), and EAC. Activity Total PV 1 2 3 4 5 6 7 8 9 10 11 12 13 14 1 6 6 2 20 10 10 3 30 9 6 6 6 3 4 20 8 2 5 5 5 16 4 4 4 4 6 18 9 9 7 8 4 4 Status Report: Ending Period 5 Task %...
-
(1) Given A and i. (1a) Find the equivalent amount at the end of year 1. (1b) Find the equilvalent amount at the end of year B. (2) Given X and i, Find the annual equivalent A from year S to 8. *...
-
Allergan is a major pharmaceutical firm. You work for Allergan's CFO and are evaluating a major and expensive drug trial. The drug trial would require an investment of $95 million today If the trial...
-
1) The following information relates to the ABCs depreciable assets. Class 1 - During 2020, a new office building was acquired at a total cost of $623,000. Of this total, it is estimated that the...
-
What is a legal letter? What external parties could an auditor send a confirmation to? What other parties provide representation letters to an auditor?
-
When doing research online, what advantages does a research search engine provide, compared to a general search engine?
-
On a distant planet small-amplitude waves travel across a \(1-\mathrm{m}\)-deep pond with a speed of \(5 \mathrm{~m} / \mathrm{s}\). Determine the acceleration of gravity on the surface of that...
-
1. What is the probability of rolling a five on a single roll of a die? What are the odds for this event? 2. From a sample of 9,750 Ajax trucks, 273 developed transmission problems within the first...
-
If following code was executed, what is the final value of variable y? y=2; for k=0: 3 y = y +2*k; end
-
7. Copper Mines, Inc (CMI) . purchased property for the purpose of extracting copper ore. CMl paid $3,500,000 for the property plus $100,000 closing costs. CMl estimates it will be able to extract...
-
The diagram below shows a lamb shade in the shape of an open frustum of an open bases right pyramid. The base PQRS is a square of sides 25cm. the top TUVIMs a square of side 10cm and each of the...
-
Eckel recently set up a TDA to save for his retirement. He arranged to have $130 taken out of each of his biweekly checks; it will earn 9 7/8% interest. He just had his twenty-ninth birthday, and his...
-
How much money will Bay Path realize from its $50 million bond issue if the actual yield is either 5% or 7%?
-
Which company is in the best position to meet short-term obligations? Which company is in the best position to meet short-term obligations?
-
What is the maximum theoretical throughput between host A and host B in the diagram below. A Answer: B 10 GBPS 2 GBPS 5 GBPS
-
Suppose that P(B|A) = 2/5, P(B) = 3/5 and P(A) = 1/2. What is P(B|AC)?
-
In a warehouse, a large heavy crate of 1237kg needs to be lifted by an industrial crane. The student working in the warehouse found the 2 strongest slings available. Each sling has a safety rating of...
-
(a) What do data breach notification laws require? (b) Why has this caused companies to think more about security?
-
In the model y = + 1 x 1 + 2 x 2 , suppose that x 2 is an indicator variable for gender, equaling 1 for females and 0 for males. a. We set x 2 = 0 if we want a predicted mean without knowing...
-
A Harris poll of a random sample of 2250 adults in the United States in 2013 reported that 74% believe in God, 68% believe in heaven, 58% believe in hell, and 42% believe in ghosts.4 (Interestingly,...
-
Your instructor will pick a medical topic of interest to the class. Find a recent article of a medical journal that reports results of a research study on that topic. Describe the statistical...
-
How did the Fed hit its target for the federal funds rate in the pre-2008 scarce-reserves regime?
-
Draw a demand and supply graph for the federal funds market to show the demand and supply of reserves in the current ample-reserves regime. How can the Fed increase the federal funds rate? Show the...
-
What is the zero lower bound in monetary policy? What tools can the Fed use if it wants to implement an expansionary monetary policy at the zero lower bound?

Study smarter with the SolutionInn App