

Question: Accounting Please help! BC Technology In this exercise you will interact with the BC Technology Dashboard to answer some questions about the companys financial performance.
Accounting Please help!
BC Technology
In this exercise you will interact with the BC Technology Dashboard to answer some questions about the companys financial performance. The dashboard focuses on revenue and gross profit for the second half of 2020.
BC Technology sells a variety of technology-based products and provides tech services and training in a B2B market. BC Technology operates in three regions across the U.S. with dedicated sales people assigned to each of the market areas.
Preparing for this exercise
You will need Excel 2016 or newer (Office 365) on your PC in order to complete this exercise.
 Download the ACCT-1-01-EXCEL.xlsm file to your PC.
-
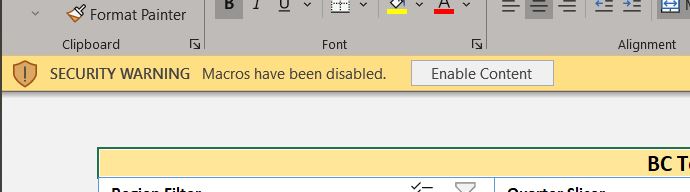
 Open the Excel file. Note, this is a Macro enabled workbook and,
 - depending on the security settings of your PC, you may see a security warning asking you to allow macros to run on your computer.
- Select Enable Content if you do see this message.
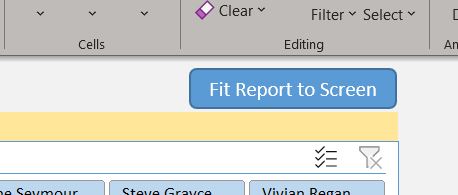
- In the upper right-hand corner of the Excel worksheet, click on the Fit Report to Screen button.
Exploring the BC Technology dashboard
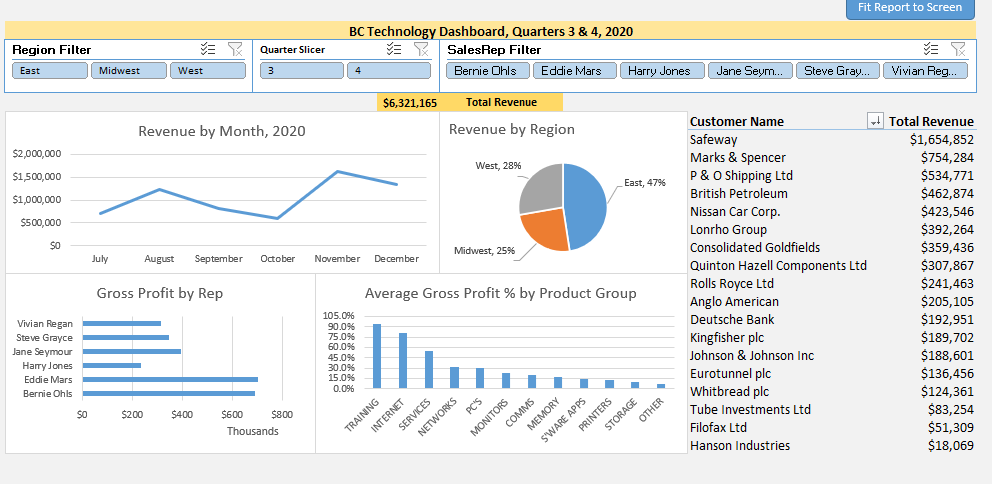
Which month had the greatest amount of revenue? How much revenue in that month? (Hint: hover the cursor on the trend line in the Revenue by Month visualization)
| Month | |
| Dollar amount of revenue |
Which Region generated the greatest share of revenue? What is the percentage share and dollar amount for that region? (Hint: hover the cursor on the pie slices in the Revenue by Region visualization)
| Region | |
| Percentage share of revenue | |
| Dollar amount of revenue |
Which product group generated the highest average gross profit percentage? What is that gross profit percentage?
| Product Group | |
| Gross Profit % |
Which SalesRep generated the least amount of gross profit? What is that SalesReps dollar amount of gross profit.
| SalesRep | |
| Dollar amount of Gross Profit |
Interacting with the dashboard
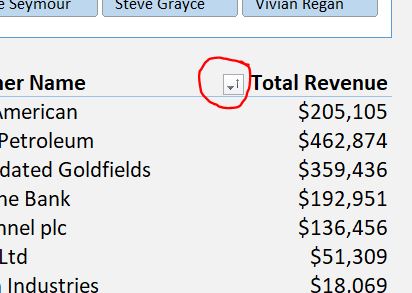
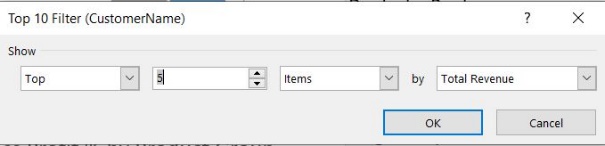
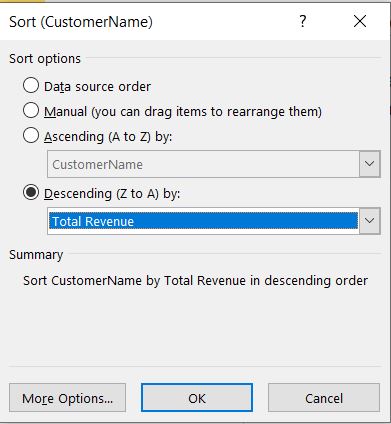
Who are the top 5 customers? (Hint: Select the AutoSort button next to the Customer Name header in the table showing Revenue > Value Filters > Top 10, change this to show the top 5 items by Total Revenue, select OK. Select the AutoSort button again > More Sort Options > Descending (Z toA) by: Total Revenue, click OK.
| Customer Name | Dollar amount of Revenue |
Select the AutoSort button again and select Clear Filter from Customer Name.
Drill down on Hanson Industries to determine the dollar amount the largest transaction, the date of the transactions, and the SalesRep. (Hint: Double click on the Total Revenue amount for Hanson Industries. Note that a new worksheet (Sheet 1) is created. This sheet queried the dataset and lists all the details of every transaction for Hanson. Scroll right to the column Transactions[TxRevenue]. Select the dropdown arrow in the column header and select Sort Largest to Smallest.)
| Dollar amount of largest transaction (Transactions[TxRevenue]) | |
| Date of transaction (Transactions[TxDate]) | |
| Sales Rep (Transactions[SalesRep]) |
Right click on the sheet name Sheet1 and select Delete and confirm Delete
It appears that October was overall the worst month in terms of revenue. Is that true for each of the regions individually? (Hint: Select each region, one at a time, from the Region Filter and note the dollar amount of revenue in its worst month)
| Region | Worst Month | Dollar amount of Revenue |
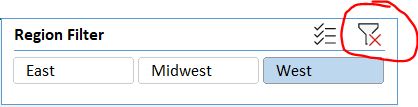
Be sure to clear the filter by clicking on the funnel icon with the red X.
Which SalesReps are responsible for the East Region? West Region? (Hint: Select a region in the Region Filter and note which SalesReps are highlighted in the SalesRep Filter)
| Region | SalesReps |
Be sure to clear the filter again by clicking on the funnel icon with the red X.
Is the percentage share of revenue by region similar for both the 3rd and 4th quarters of the year? (Hint: Select the quarter in the Quarter Filter and note the percentage share of revenue)
| Quarter | % Share East | % Share Midwest | % Share West |
| Quarter 3 & 4 combined | |||
| Quarter 3 | |||
| Quarter 4 |
Be sure to clear the filter by clicking on the funnel icon with the red X.
Identify the best Customer in each Region. (Hint: Select a region in the Region Filter and note the top customer and amount of revenue).
| Region | Best Customer Name | Dollar amount of Revenue |
Be sure to clear the filter by clicking on the funnel icon with the red X.
Who is Harry Jones best customer?
Who is Vivian Regans best customer in the 3rd Quarter?
Save this word document and submit as instructed.
Close the ACCT-1-01-EXCEL.xlsm file without saving.
Format Painter Clipboard Font Alignment (1) SECURITY WARNING Macros have been disabled. Enable Content Clear Filter Select Cells Editing Fit Report to Screen lerNamemericanPetroleumdatedGoldfieldsieBankinelplcLtdIndustriesTotalRevenue$205,105$462,874$359,436$192,951$136,456$51,309$18.069 Top 10 Filter (CustomerName) Data source order Manual (you can drag items to rearrange them) Ascending ( A to Z ) by: Descending ( Z to A) by: Summary Sort CustomerName by Total Revenue in descending order Revenue by Region Format Painter Clipboard Font Alignment (1) SECURITY WARNING Macros have been disabled. Enable Content Clear Filter Select Cells Editing Fit Report to Screen lerNamemericanPetroleumdatedGoldfieldsieBankinelplcLtdIndustriesTotalRevenue$205,105$462,874$359,436$192,951$136,456$51,309$18.069 Top 10 Filter (CustomerName) Data source order Manual (you can drag items to rearrange them) Ascending ( A to Z ) by: Descending ( Z to A) by: Summary Sort CustomerName by Total Revenue in descending order Revenue by Region
Step by Step Solution
There are 3 Steps involved in it

Get step-by-step solutions from verified subject matter experts