

The annual report of Tri-State Cars, Inc., for the year ended December 31, 2018, included the...
Fantastic news! We've Found the answer you've been seeking!
Question:

Transcribed Image Text:
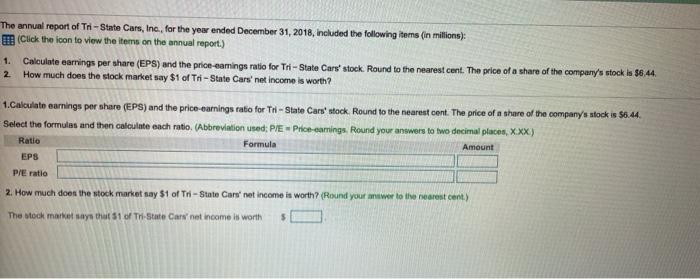
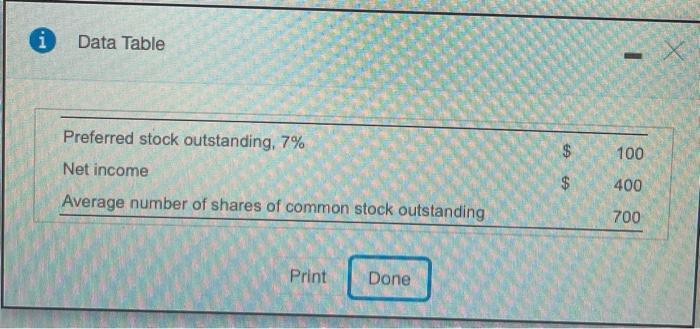
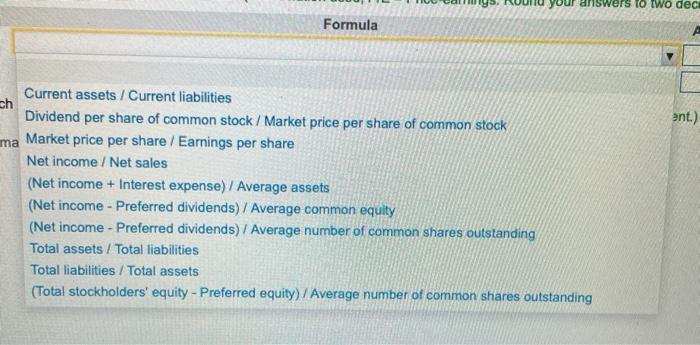
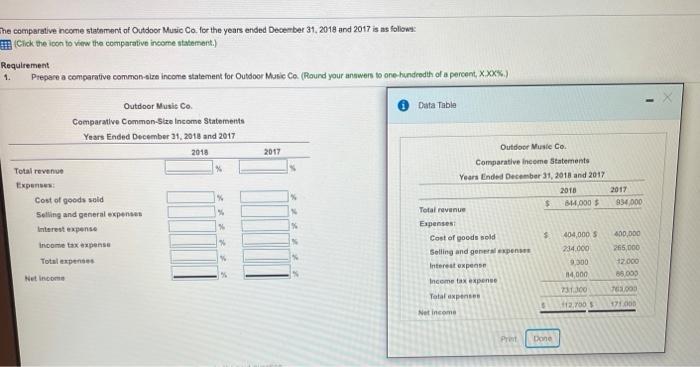
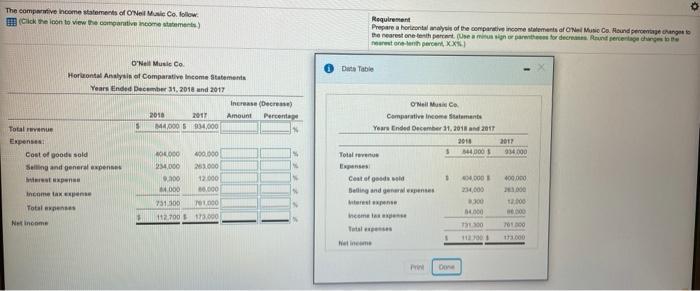
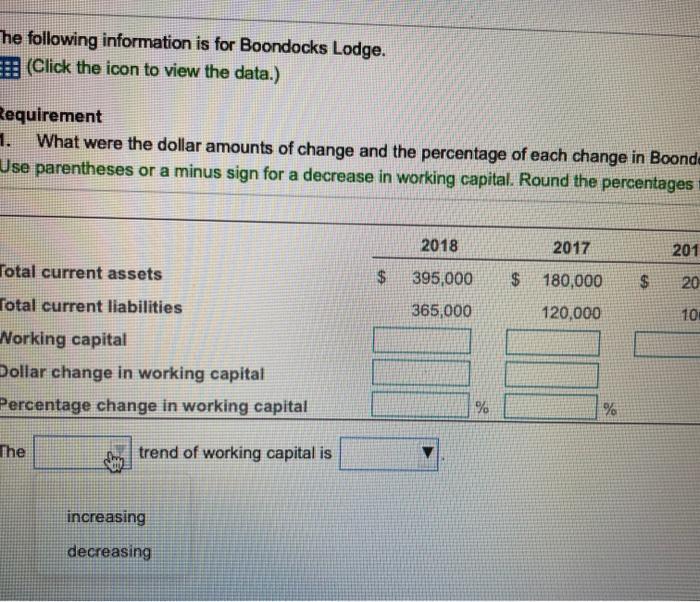
The annual report of Tri-State Cars, Inc., for the year ended December 31, 2018, included the following items (in millions): m (Click the icon to view the items on the annual report.) 1. Calculate earnings per share (EPS) and the price-eamings ratio for Tri - State Cars' stock. Round to the nearest cent. The price of a share of the company's stock is $6.44. 2. How much does the stock market say $1 of Tri - State Cars' net income is worth? 1.Calculate earnings per share (EPS) and the price-earnings ratio for Tri - State Cars' stock. Round to the nearest cent. The price of a share of the company's stock is $6.44. Select the formulas and then calculate each ratio. (Abbreviation used; PIE - Price-eamings. Round your answers to two decimal places, XXX) Ratio Formula Amount EPS P/E ratio 2. How much does the stock market say $1 of Tri- State Cars' net income is worth? (Round your answer to the nearest cent.) The stock market says that $1 of Tr-State Cars' net income is worth Data Table Preferred stock outstanding, 7% 100 Net income 400 Average number of shares of common stock outstanding 700 Print Done your ers to two dec Formula Current assets / Current liabilities ch Dividend per share of common stock / Market price per share of common stock ent.) ma Market price per share / Earnings per share Net income / Net sales (Net income + Interest expense) /I Average assets (Net income - Preferred dividends) / Average common equity (Net income - Preferred dividends) / Average number of common shares outstanding Total assets / Total liabilities Total liabilities / Total assets (Total stockholders' equity - Preferred equity) / Average number of common shares outstanding The comparative income statement of Outdoor Music Co. for the years ended December 31, 2018 and 2017 is as follows: Click the lcon to view the comparative income statement.) Requirement 1. Prepare a comparative common-aize income statement for Outdoor Music Co. (Rourd your anawers to one-hundredth of a percent, XXX%.) Outdoor Music Co. Data Table Comparative Common-Size Income Statements Years Ended December 31, 2018 and 2017 Outdoor Musle Co. 2018 2017 Comparative income Statements Total revenue Years Ended December 31, 2018 and 2017 Expenses: 2010 2017 Cost of goods sold 844,000 S 834000 Total revenue Seling and general expenses Espenses: Interest expense 404,000 S 400,000 Cost of goode nold Income tax expense 234.000 265,000 Selling and general expenses Total expenses 9.300 42.000 Interest expense 4,000 86.000 Net income Income tax expense 731.300 763.000 Total expensee f12,700 S 171.000 Net income Pret Done The compartive income statements of ONeil Music Co. follow (Cick the icon to view the companative income statements) Requirement Prepare a horizontal analysis of the comparative income statements of ONel Music Co. Hound percentage changen t the nearest one tenth percent. (Use a minus ign or parenthees for decreaes Rund percentage hang lo he nearest one-enih pecent, KX) O'Nell Music Co. Dita Table Horizontal Analysin of Comparative ncome Statementa Years Ended December 31, 2018 and 2017 Inerease (Decrease) O'Nell Musi Co 2010 2017 Amount Percentage Comparative Income Statements M4,000 S 934,000 Years Ended December 31, 201 and 2017 Total revenue Expenses: 2018 2017 Cost of goode sold 400.000 Total revenue 44000 934000 Selling and general expenses 234.000 263.000 Expenses nterest xpense 12.000 Cest ef geods eld 4.000 400,000 .000 0.000 Belling and general espenses 234,000 23000 Income tax xpense 751.300 701.000 terest pense 300 12.00 Total expenses 000 t12.700 173.000 inceme le pense Net income 701.000 Tatal epenses 112.700 173.000 Net income Print Oone The following information is for Boondocks Lodge HR (Click the loon to view the date.) Requirement 1. What were the dollar amounts of change and the percentege of each change in Boondocks Lodge's net working captal during 2018 and 20172 is this trend favorable or untavorable? (Use parentheses or a minus sign for e decrease in working capital. Round the peroentages to the nearest one tenth percent, XXN) 2018 S 305.000 2017 2016 Data Table Total current assets S180.000 200.000 Total current labilities 5,000 120.000 100.000 Working capital 2018 2017 2016 Dollar change in working captal Total curret assets 5 306,000 $ 180,000 S 200,000 Percentage change in working capital Total curent liabilitina 365.000 120.000 100,000 The Mrend af working cpital is Print Done he following information is for Boondocks Lodge. H (Click the icon to view the data.) Requirement 1. What were the dollar amounts of change and the percentage of each change in Boonde Use parentheses or a minus sign for a decrease in working capital. Round the percentages 2018 2017 201 Total current assets $4 395,000 $ 180,000 $4 20 Total current liabilities 365,000 120,000 10 Norking capital Dollar change in working capital Percentage change in working capital The trend of working capital is increasing decreasing The annual report of Tri-State Cars, Inc., for the year ended December 31, 2018, included the following items (in millions): m (Click the icon to view the items on the annual report.) 1. Calculate earnings per share (EPS) and the price-eamings ratio for Tri - State Cars' stock. Round to the nearest cent. The price of a share of the company's stock is $6.44. 2. How much does the stock market say $1 of Tri - State Cars' net income is worth? 1.Calculate earnings per share (EPS) and the price-earnings ratio for Tri - State Cars' stock. Round to the nearest cent. The price of a share of the company's stock is $6.44. Select the formulas and then calculate each ratio. (Abbreviation used; PIE - Price-eamings. Round your answers to two decimal places, XXX) Ratio Formula Amount EPS P/E ratio 2. How much does the stock market say $1 of Tri- State Cars' net income is worth? (Round your answer to the nearest cent.) The stock market says that $1 of Tr-State Cars' net income is worth Data Table Preferred stock outstanding, 7% 100 Net income 400 Average number of shares of common stock outstanding 700 Print Done your ers to two dec Formula Current assets / Current liabilities ch Dividend per share of common stock / Market price per share of common stock ent.) ma Market price per share / Earnings per share Net income / Net sales (Net income + Interest expense) /I Average assets (Net income - Preferred dividends) / Average common equity (Net income - Preferred dividends) / Average number of common shares outstanding Total assets / Total liabilities Total liabilities / Total assets (Total stockholders' equity - Preferred equity) / Average number of common shares outstanding The comparative income statement of Outdoor Music Co. for the years ended December 31, 2018 and 2017 is as follows: Click the lcon to view the comparative income statement.) Requirement 1. Prepare a comparative common-aize income statement for Outdoor Music Co. (Rourd your anawers to one-hundredth of a percent, XXX%.) Outdoor Music Co. Data Table Comparative Common-Size Income Statements Years Ended December 31, 2018 and 2017 Outdoor Musle Co. 2018 2017 Comparative income Statements Total revenue Years Ended December 31, 2018 and 2017 Expenses: 2010 2017 Cost of goods sold 844,000 S 834000 Total revenue Seling and general expenses Espenses: Interest expense 404,000 S 400,000 Cost of goode nold Income tax expense 234.000 265,000 Selling and general expenses Total expenses 9.300 42.000 Interest expense 4,000 86.000 Net income Income tax expense 731.300 763.000 Total expensee f12,700 S 171.000 Net income Pret Done The compartive income statements of ONeil Music Co. follow (Cick the icon to view the companative income statements) Requirement Prepare a horizontal analysis of the comparative income statements of ONel Music Co. Hound percentage changen t the nearest one tenth percent. (Use a minus ign or parenthees for decreaes Rund percentage hang lo he nearest one-enih pecent, KX) O'Nell Music Co. Dita Table Horizontal Analysin of Comparative ncome Statementa Years Ended December 31, 2018 and 2017 Inerease (Decrease) O'Nell Musi Co 2010 2017 Amount Percentage Comparative Income Statements M4,000 S 934,000 Years Ended December 31, 201 and 2017 Total revenue Expenses: 2018 2017 Cost of goode sold 400.000 Total revenue 44000 934000 Selling and general expenses 234.000 263.000 Expenses nterest xpense 12.000 Cest ef geods eld 4.000 400,000 .000 0.000 Belling and general espenses 234,000 23000 Income tax xpense 751.300 701.000 terest pense 300 12.00 Total expenses 000 t12.700 173.000 inceme le pense Net income 701.000 Tatal epenses 112.700 173.000 Net income Print Oone The following information is for Boondocks Lodge HR (Click the loon to view the date.) Requirement 1. What were the dollar amounts of change and the percentege of each change in Boondocks Lodge's net working captal during 2018 and 20172 is this trend favorable or untavorable? (Use parentheses or a minus sign for e decrease in working capital. Round the peroentages to the nearest one tenth percent, XXN) 2018 S 305.000 2017 2016 Data Table Total current assets S180.000 200.000 Total current labilities 5,000 120.000 100.000 Working capital 2018 2017 2016 Dollar change in working captal Total curret assets 5 306,000 $ 180,000 S 200,000 Percentage change in working capital Total curent liabilitina 365.000 120.000 100,000 The Mrend af working cpital is Print Done he following information is for Boondocks Lodge. H (Click the icon to view the data.) Requirement 1. What were the dollar amounts of change and the percentage of each change in Boonde Use parentheses or a minus sign for a decrease in working capital. Round the percentages 2018 2017 201 Total current assets $4 395,000 $ 180,000 $4 20 Total current liabilities 365,000 120,000 10 Norking capital Dollar change in working capital Percentage change in working capital The trend of working capital is increasing decreasing
Expert Answer:
Answer rating: 100% (QA)
Tri State Cars Inc Requirement 1 EPS Net Income Preferred d... View the full answer

Related Book For 
Posted Date:
Students also viewed these accounting questions
-
The following data relate to inventory for the year ended December 31, 2009. A physical inventory on December 31, 2009, indicates that 600 units are on hand and that they came from the July 1...
-
The following data are from the annual report of Francisco Company, a specialized packaging manufacturer: Potter Company, a manufacturer of glassware, made the following acquisitions of Francisco...
-
The following data are excerpted from the annual report of Lands End: Required: a. Discuss three factors that determine the level of sales and the level of gross profit as a percentage of sales in...
-
3. (15 pts.) The random variables X and Y have joint density function fxx(x, y) x-?y?, x > 1, y > 1. Compute the cdf and pdf of the random variable U = XY.
-
Give an example of an innovation from an organization you work for or have worked for. Be sure to specify whether it was a product innovation or a process innovation.
-
In Web Exercise 1 you collected and graphed the Dow Jones Industrial Average. Now go to www.forecasts .org. Click on "Stock Market Forecast" and then on "Dow Jones Industrial Average" in the left...
-
Apex Electrical Supply, Inc., purchased inventory for \($2,000\) and also paid \($125\) freight to have the inventory delivered. Apex Electrical Supply, Inc., returned \($500\) of the goods to the...
-
Suppose the following items were taken from the balance sheet of Nike, Inc. (All dollars are in millions.) Instructions Perform each of the following. (a) Classify each of these items as an asset,...
-
Maple Forest Corporation designs and produces a line of golf equipment and golf apparel. Maple Forest has 100,000 shares of common stock outstanding as of the beginning of 2024. Maple Forest has the...
-
Suppose that a firm in a perfectly competitive market has the following revenue and cost functions: R(q) = pq and C(q) = 75+ 0.07q+0.04q. Since this firm can sell any quantity of production at a...
-
Determine the failure rate for a 90-hour test of 12 items where 2 items fail at 45 and 72 hours, respectively. W hat is the mean life of the product? 500 hours 275 hours 725 hours 375 hours
-
What might shift the AD curve to the left? Use the model of AD and AS to trace through the effects of such a shift.
-
Why do economists place such importance on the role of expectations in macroeconomic policy?
-
Outline the arguments for and against an active stabilization policy.
-
List and explain the three theories for why the SRAS curve is upwards sloping.
-
Explain why the LRAS curve is vertical.
-
What important step should be taken early in the information life cycle to ensure that orga- nizations can handle the data they collect?
-
The following exercises are not grouped by type. Solve each equation. x610x -9
-
On August 4, Big Luggage Super Store (BLSS) had eight identical black briefcases in stock. The cost of each briefcase is given in the following list in the order that the briefcases were purchased....
-
Selected transactions for Adler Co. follow. On January 1, 2009, Adler Co. invested $300,000 of Walker, Inc. common stock On November 15, 2009, Adler Co. received a $5,000 dividend from Walker, Inc....
-
How are signicant non cash investing and financing activities typically reported in a set of nancial statements? Other than the example provided in the book, give two examples of signicant noncash...
-
Should the instruction following the TEST instruction be interruptible? If so, what must the implicit BRANCH instruction (interrupt) do?
-
It seems that there are far fewer commercial implementations of SIMD, MIMD, and MISD architectures than there were just 10 years ago. This is probably due to a variety of factors, including high...
-
GCP, Inc., has contracted you to analyze and develop commercial off-the-shelf (COTS) processors to be phased into their existing product lines. Your objective is to select four popular commercial...

Study smarter with the SolutionInn App